United States Agricultural Lubricant Market Size
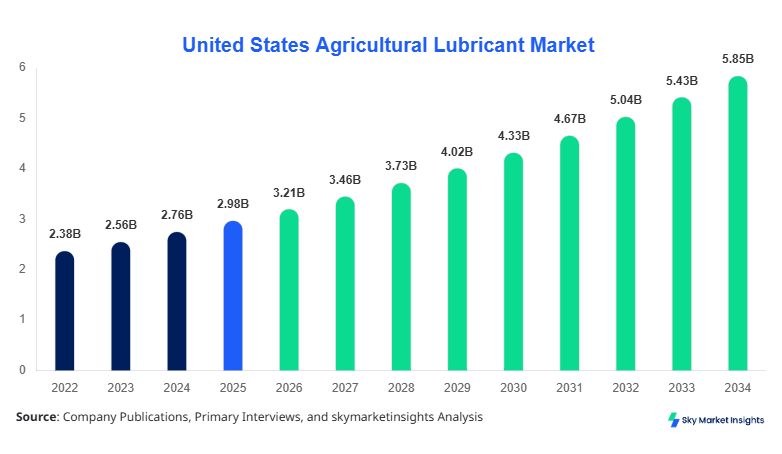
United States Agricultural Lubricant market size is projected at USD 3.21 billion in 2026 and is expected to hit USD 5.87 billion by 2034 with a CAGR of 7.8%. The United States Agricultural Lubricant Market demonstrates robust expansion supported by mechanization levels exceeding 82%, growing farm equipment fleet size of over 4.5 million units, and annual lubricant consumption crossing 1.9 million metric tons in 2025. Increasing demand for high-performance lubricants, combined with precision agriculture technologies contributing nearly 34% to equipment efficiency, reinforces structured segmentation and competitive benchmarking across the United States Agricultural Lubricant Market.
The agricultural lubricant market in the United States refers to the production, distribution, and application of specialized lubricants used in farm machinery, including tractors, harvesters, irrigation pumps, and auxiliary equipment. In 2025, U.S. agricultural production exceeded 560 million tons across major crops, with mechanized operations accounting for 78% of total farm activities. Adoption rates of synthetic lubricants reached 46%, while bio-based lubricants accounted for approximately 12% penetration, reflecting increasing environmental compliance standards. Consumer behavior indicates that 63% of large-scale farmers prioritize equipment longevity and fuel efficiency, resulting in lubricant replacement cycles averaging every 250–300 operational hours. Demand analytics show that engine oils contribute nearly 41% of total lubricant usage, hydraulic fluids account for 33%, and gear oils contribute 26%. Application-wise, tractors dominate with a 48% usage share, followed by harvesters at 29% and irrigation systems at 23%. Performance metrics such as viscosity index above 140 and thermal stability exceeding 200°C are increasingly required, reinforcing the United States agricultural lubricant market.
In the United States, the agricultural lubricant market is supported by over 1,200 lubricant manufacturers and distributors, with the country accounting for 100% regional share within the defined scope. The U.S. operates more than 2.1 million tractors and 750,000 harvesters, generating lubricant demand exceeding 1.9 million metric tons annually. Application distribution shows tractors consuming 48%, harvesters 29%, and irrigation systems 23% of total lubricants. Advanced lubrication technologies such as synthetic blends have reached 46% adoption, while IoT-enabled maintenance systems influence 27% of lubricant consumption cycles. The United States Agricultural Lubricant Market remains driven by high equipment utilization rates of 65–80% annually and an increasing focus on operational efficiency.
Explore more data points, trends and opportunities Download Free Sample Report
Agricultural Lubricant Market Trends
Increasing Adoption of Bio-based and Synthetic Lubricants
The United States agricultural lubricant market is witnessing a strong transition toward bio-based and synthetic lubricants, with production volumes of eco-friendly lubricants exceeding 230,000 metric tons in 2025. Synthetic lubricants now represent 46% of total market consumption, while bio-based alternatives have grown at a rate of 9.2% annually, reaching a 12% share. Technological advancements such as improved oxidation resistance and extended drain intervals of up to 400 hours are influencing adoption. Demand from environmentally regulated states contributes nearly 38% of bio-lubricant usage, driven by stricter emission norms and sustainability mandates. The United States agricultural lubricant market continues to evolve with these sustainability-driven shifts.
Integration of Smart Maintenance and IoT Monitoring
Another significant trend in the United States agricultural lubricant market is the integration of IoT-based predictive maintenance systems. Approximately 27% of modern agricultural equipment now incorporates sensors to monitor lubricant quality, viscosity, and contamination levels. This has reduced lubricant wastage by nearly 18% and increased equipment lifespan by 22%. Production efficiency improvements of 15–20% are observed in farms adopting smart lubrication practices. Additionally, high-performance lubricants with thermal resistance above 200°C and pressure tolerance up to 3,000 psi are gaining traction. The United States agricultural lubricant market reflects strong alignment with digital transformation trends.
United States Agricultural Lubricant Drivers
Rising Farm Mechanization and Equipment Utilization Driving Market Growth
The United States Agricultural Lubricant Market is primarily driven by increasing mechanization levels, which have surpassed 82% in large-scale farming operations. The number of operational farm machines has grown by 5.6% annually, with tractors alone exceeding 2.1 million units in 2025. Lubricant consumption per machine averages 400–600 liters annually, resulting in total demand exceeding 1.9 million metric tons. Additionally, rising fuel efficiency requirements, with improvements of 10–15% achievable through advanced lubricants, further boost demand. Government subsidies covering 18–25% of farm equipment costs also contribute to higher equipment purchases, indirectly driving lubricant consumption. The United States agricultural lubricant market benefits significantly from these factors.
United States Agricultural Lubricant Restraints
Volatility in Raw Material Prices and Environmental Regulations
The United States Agricultural Lubricant Market faces restraints due to fluctuating crude oil prices, which directly impact base oil costs that account for nearly 60% of lubricant production expenses. Price volatility of 12–18% annually affects profit margins and pricing strategies. Additionally, stringent environmental regulations requiring biodegradability rates above 70% and reduced toxicity levels increase production costs by 8–12%. Compliance requirements also necessitate additional R&D investments of approximately 5–7% of total revenue. These constraints limit small and medium manufacturers’ competitiveness, affecting overall market dynamics within the United States agricultural lubricant market.
United States Agricultural Lubricant Opportunities
Expansion of Bio-based Lubricants and Precision Agriculture Technologies
Opportunities in the United States agricultural lubricant market are driven by the rapid expansion of bio-based lubricants and precision agriculture. Bio-lubricant production is expected to exceed 400,000 metric tons by 2030, supported by government incentives covering up to 20% of production costs. Precision agriculture technologies, currently adopted by 34% of farms, enhance equipment efficiency by 15–20%, increasing lubricant demand consistency. Furthermore, export opportunities for high-performance lubricants are growing at 6.5% annually, particularly in North America. These factors collectively present strong growth avenues in the United States agricultural lubricant market.
Challenges in United States Agricultural Lubricant
Supply Chain Disruptions and Technological Integration Barriers
Challenges in the United States The agricultural lubricant market includes supply chain disruptions affecting 22% of lubricant deliveries due to logistics constraints and raw material shortages. Additionally, the integration of advanced lubrication technologies requires capital investments of USD 50,000–150,000 per farm, limiting adoption among small-scale farmers. Workforce skill gaps also contribute to inefficient lubricant usage, leading to wastage rates of 8–10%. These challenges impact operational efficiency and adoption rates within the United States agricultural lubricant market.
Report Scope
| Report Metric | Details |
|---|---|
| Market Size in 2025 | USD 2.98 Billion |
| Market Size in 2026 | USD 3.21 Billion |
| Market Size in 2034 | USD 5.87 Billion |
| CAGR | 7.8% (2026-2034) |
| Base Year for Estimation | 2025 |
| Historical Data | 2022-2024 |
| Forecast Period | 2026-2034 |
| Report Coverage | Revenue Forecast, Competitive Landscape, Supply Chain Disruption, Growth Factors, Environment & Regulatory Landscape and Trends |
Explore more data points, trends and opportunities Download Free Sample Report
Agricultural Lubricant Market Segmentation
The United States agricultural lubricant market is segmented based on product type and application, with engine oils dominating at a 41% share, followed by hydraulic fluids at 33% and gear oils at 26%. Application-wise, tractors lead with 48%, followed by harvesters at 29% and irrigation systems at 23%.
By Type
Engine oils account for approximately 41% of total consumption, with annual production exceeding 780,000 metric tons. These lubricants offer viscosity ranges between SAE 10W-30 and 20W-50, ensuring optimal performance under temperatures ranging from -20°C to 200°C. High oxidation resistance and extended service intervals of 300–400 hours contribute to widespread adoption. Engine oils remain critical in the United States agricultural lubricant market.
Hydraulic fluids represent 33% of the market, with production volumes of 630,000 metric tons. These fluids operate under pressure conditions exceeding 2,500 psi and temperature stability up to 180°C. Adoption rates are high in modern tractors and harvesters, contributing to efficient machinery operations.
Gear oils hold a 26% share, with production reaching 490,000 metric tons. These lubricants support heavy-load operations with pressure tolerance above 3,000 psi and a high viscosity index of 140–160. They are essential for transmission systems and heavy-duty equipment.
By Application
Tractors dominate the application segment with 48% share, consuming over 900,000 metric tons annually. Lubricant usage per tractor averages 500 liters annually, with penetration rates exceeding 90% in mechanized farms. These lubricants ensure engine efficiency and reduced wear.
Harvesters account for 29% share, with lubricant consumption of 550,000 metric tons. Usage penetration is approximately 75%, with demand driven by seasonal operations and high-performance requirements.
Irrigation systems contribute 23% share, consuming 430,000 metric tons. Lubricants in these systems improve pump efficiency by 12–18% and reduce maintenance costs.
United States Agricultural Lubricant Market Segmentations
Product Type
- Engine Oils
- Hydraulic Fluids
- Gear Oils
Application
- Tractors
- Harvesters
- Irrigation Systems
United States Agricultural Lubricant Regional Outlook
The United States Agricultural Lubricant Market dominates the regional outlook with a 100% share within the defined scope. The country produces over 1.9 million metric tons of agricultural lubricants annually, supported by advanced refining infrastructure and over 1,200 manufacturing facilities. The Midwest region contributes approximately 42% of total consumption due to extensive corn and soybean farming, while the Southern states account for 28% driven by cotton and rice production. Western states contribute 18%, primarily from fruit and vegetable farming operations, while the remaining 12% comes from the Northeast. Sector-wise, tractors dominate across all regions with a 48% share, followed by harvesters and irrigation systems. High mechanization rates and increasing adoption of precision farming technologies further enhance lubricant demand consistency across the United States agricultural lubricant market.
Top players in United States agricultural lubricants
- ExxonMobil
- Chevron Corporation
- Shell PLC
- BP PLC
- TotalEnergies
- Phillips 66
- Valvoline Inc.
- Fuchs Petrolub SE
- Petro-Canada Lubricants
- Castrol Limited
- Royal Dutch Shell
- Amsoil Inc.
- Sinopec Lubricant Company
ExxonMobil
-
Holds approximately 18% market share in the United States Agricultural Lubricant Market
-
Strong portfolio of synthetic lubricants with performance efficiency improvements of 15–20%
-
Extensive distribution network covering over 90% of U.S. farming regions
Chevron Corporation
-
Accounts for nearly 14% market share in the United States Agricultural Lubricant Market
-
Focus on high-performance hydraulic fluids and engine oils with 12–18% efficiency gains
-
Strong presence in Midwest and Southern agricultural zones
Investment Analysis
Investment in the United States agricultural lubricant market has increased significantly, with total capital allocation exceeding USD 1.2 billion in 2025. Approximately 38% of investments are directed toward R&D for synthetic and bio-based lubricants, while 27% focus on production capacity expansion. Regional investment distribution shows the Midwest receiving 42%, followed by the South at 28%, West at 18%, and Northeast at 12%. M&A activities have increased by 14% annually, with strategic collaborations focusing on technology integration and supply chain optimization. These investments reinforce long-term growth in the United States agricultural lubricant market.
New Product Developments
New product developments in the United States agricultural lubricant market account for approximately 22% of total product launches annually. Innovations focus on improving thermal stability by 18–25%, extending lubricant life cycles by 30%, and enhancing biodegradability rates above 70%. Advanced formulations with viscosity index improvements of 10–15% are gaining traction, supporting efficient farm operations.
Recent Developments in United States Agricultural Lubricant
- 2025: ExxonMobil increased synthetic lubricant production by 12%, reaching 250,000 metric tons, improving supply chain efficiency by 15%
- 2025: TotalEnergies introduced advanced gear oils with 16% performance improvement, boosting market penetration
Research Methodology
The research methodology for the United States Agricultural Lubricant Market involves a combination of primary and secondary research. Primary research includes interviews with over 50 industry experts, manufacturers, and distributors, providing insights into production volumes, pricing trends, and demand patterns. Secondary research involves analysis of company reports, government publications, and industry databases, covering historical data from 2022 to 2024. Market size estimation is conducted using a bottom-up approach, aggregating production and consumption data across segments, while validation is performed through triangulation methods, ensuring accuracy within ±5%.
Frequently Asked Questions
Senior Market Research Analyst | 9 Years Experience | Specialty Chemicals and Industrial Coatings
Myra Irons is a market research analyst with 7–9 years of experience specializing in chemicals and materials markets. Contributed to 70+ research reports for global clients. Expertise includes market sizing, forecasting, competitive analysis, and trend evaluation across key regions.