North America Agricultural Machinery Drive Belt Market Size
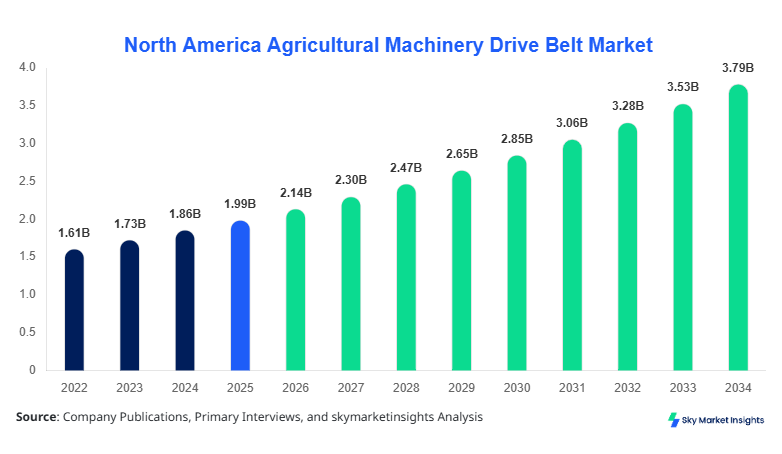
The North American agricultural machinery drive belt market size is projected at USD 2.14 billion in 2026 and is expected to hit USD 3.78 billion by 2034 with a CAGR of 7.4%. The increasing mechanisation rate, which has reached over 78% farm penetration in 2025, is significantly driving the demand for high-performance belts across tractors and harvesters. The market is witnessing strong segmentation based on type and application, where V-belts alone account for nearly 46% share, while tractors contribute around 52% of total consumption volume exceeding 185 million units annually. Competitive landscape analysis shows over 35 key manufacturers actively supplying belts across North America, with technological upgrades improving durability by 18%–25%. The North American agricultural machinery drive belt market size reflects rising automation and replacement demand cycles across agricultural equipment.
The North America Agricultural Machinery Drive Belt Market refers to the production, distribution, and utilisation of drive belts used in agricultural machinery for power transmission between rotating shafts. In 2025, total production volume exceeded 265 million units across North America, with the United States contributing nearly 72% of output. Adoption and penetration insights indicate that over 68% of medium-to-large farms utilise advanced belt-driven machinery, while replacement cycles average between 2 and 4 years due to wear and tear. Consumer behaviour shows an increasing preference for high-tensile synthetic belts with a 22% higher load capacity and 15% improved thermal resistance. Demand analytics reveal that tractors dominate with 52% application share, followed by harvesters at 31% and balers at 17%. Technical metrics such as operating speed (up to 5,000 RPM) and efficiency rates above 92% are key performance indicators. The North American agricultural machinery drive belt market continues to expand with rising mechanisation demand.
In the United States, the Agricultural Machinery Drive Belt Market holds approximately 72% of the regional share, supported by over 18,500 agricultural equipment manufacturing and servicing facilities. The country produces more than 190 million drive belt units annually, with tractors accounting for 54% usage, harvesters 29%, and balers 17%. Technology adoption has increased significantly, with nearly 64% of machinery integrating high-performance synthetic belts capable of handling torque loads above 1,200 Nm. Additionally, over 58% of farms have adopted advanced machinery systems, leading to higher replacement demand cycles and boosting aftermarket sales by 21% in 2025. The United States agricultural machinery drive belt market remains dominant due to high farm mechanisation and continuous technological upgrades.
Explore more data points, trends and opportunities Download Free Sample Report
Agricultural Machinery Drive Belt Market Trends
Increasing Adoption of High-Durability Synthetic Belts
The market is witnessing a notable shift toward synthetic and reinforced belts, which accounted for nearly 48% of total production volume in 2025, equivalent to over 127 million units. These belts offer 20% higher tensile strength and 18% longer lifespan compared to traditional rubber belts. The integration of aramid fibre and polyurethane materials is enhancing performance in extreme weather conditions, especially in North America, where temperature variations range from -20°C to 40°C. Adoption rates of such advanced belts have increased by 27% over the past three years, driven by demand for reduced downtime and maintenance costs. The agricultural machinery drive belt market is evolving with durability-focused innovations.
Automation and Smart Machinery Integration
Automation trends are influencing belt demand, with nearly 61% of new agricultural machinery incorporating automated drive systems in 2025. Production of smart tractors exceeded 2.8 million units globally, with North America contributing around 18% share. These systems require precision-engineered timing belts capable of maintaining synchronisation at speeds above 4,500 RPM. The use of IoT-enabled sensors in machinery has increased belt monitoring efficiency by 23%, reducing failure rates by 15%. Demand from precision farming applications is growing at 8.2% annually, further boosting the agricultural machinery drive belt market.
North American Agricultural Machinery Drive Belt Market Drivers
Rising Farm Mechanization and Equipment Modernization
The expansion of farm mechanisation across North America is a key driver, with mechanisation rates increasing from 65% in 2020 to over 78% in 2025. The region operates more than 5.6 million agricultural machines, each requiring multiple drive belts, resulting in annual demand exceeding 260 million units. Tractors alone consume nearly 140 million belts annually due to frequent usage and replacement cycles. Additionally, modernisation initiatives have increased investment in high-performance equipment by 32% over the last five years. Advanced machinery requires belts capable of handling higher loads and speeds, with efficiency improvements reaching 92%–95%. Government subsidies covering up to 25% of machinery costs further encourage adoption. The agricultural machinery drive belt market growth is strongly supported by mechanisation trends.
North America Agricultural Machinery Drive Belt Market Restraints
Volatility in Raw Material Prices and Supply Chain Disruptions
The market faces challenges due to fluctuating prices of raw materials such as rubber and synthetic polymers, which have seen price increases of 18%–24% between 2022 and 2025. Supply chain disruptions have led to delays of up to 6–8 weeks in belt production cycles, impacting manufacturers and end-users. Additionally, import dependency for certain materials remains at 35%, exposing the market to geopolitical risks. Rising production costs have increased average belt prices by 12%, affecting affordability for small-scale farmers. Furthermore, limited availability of skilled labour in manufacturing facilities has reduced production efficiency by 9% in some regions. These factors act as constraints on the agricultural machinery drive belt market growth.
North America Agricultural Machinery Drive Belt Market Opportunities
Expansion of Precision Agriculture and Smart Farming Technologies
Precision agriculture adoption has grown to 44% of total farms in North America, creating significant opportunities for advanced drive belts. Smart farming equipment requires high-precision timing belts with synchronisation accuracy above 98%, driving demand for technologically advanced products. Investment in precision agriculture exceeded USD 1.8 billion in 2025, with 36% allocated to machinery upgrades. The integration of GPS and IoT systems in machinery is increasing demand for specialised belts by 19% annually. Additionally, emerging markets within Canada show a 14% increase in mechanisation rates, offering expansion opportunities. The agricultural machinery drive belt market benefits from technological advancements in agriculture.
Challenges in North America's Agricultural Machinery Drive Belt Market
High Maintenance Costs and Product Lifecycle Limitations
One of the major challenges is the relatively short lifecycle of drive belts, which typically ranges between 2 and 4 years depending on usage intensity. Frequent replacements lead to increased maintenance costs, which have risen by 16% over the past three years. Farmers operating large fleets of machinery spend approximately USD 1,200–USD 2,500 annually on belt replacements. Additionally, improper installation and lack of technical expertise result in failure rates of nearly 12%–15%. Environmental factors such as dust, heat, and moisture further reduce belt efficiency by 10%–18%. These challenges impact the agricultural machinery drive belt market.
Report Scope
| Report Metric | Details |
|---|---|
| Market Size in 2025 | USD 1.99 Billion |
| Market Size in 2026 | USD 2.14 Billion |
| Market Size in 2034 | USD 3.78 Billion |
| CAGR | 7.4% (2026-2034) |
| Base Year for Estimation | 2025 |
| Historical Data | 2022-2024 |
| Forecast Period | 2026-2034 |
| Report Coverage | Revenue Forecast, Competitive Landscape, Supply Chain Disruption, Growth Factors, Environment & Regulatory Landscape and Trends |
Explore more data points, trends and opportunities Download Free Sample Report
Agricultural Machinery Drive Belt Market Segmentation
The Agricultural Machinery Drive Belt Market is segmented by type and application, with V-belts dominating at 46% share, followed by timing belts at 34% and flat belts at 20%. Application-wise, tractors lead with 52% share, harvesters with 31%, and balers with 17%, reflecting diverse usage patterns.
By Type
V-belts dominate the market with a 46% share, accounting for over 120 million units produced annually. These belts offer high frictional grip and efficiency levels of 90%–93%, making them suitable for tractors and harvesters. Their ability to handle loads up to 1,000 Nm and operate at speeds up to 4,000 RPM ensures widespread adoption. Replacement cycles average 2.5 years, driving aftermarket demand.
Timing belts hold a 34% share, with production exceeding 90 million units annually. These belts provide synchronisation accuracy above 98% and are widely used in advanced machinery. Their load capacity reaches 1,200 Nm, with operating speeds up to 5,000 RPM. Adoption has increased by 21% due to precision farming requirements.
Flat belts account for 20% share, with around 55 million units produced annually. These belts offer efficiency levels up to 92% and are used in specific machinery requiring smooth power transmission. Their lower cost and flexibility contribute to steady demand.
By Application
Tractors dominate with 52% share, consuming over 140 million belts annually. Usage penetration exceeds 80% across farms, with belts supporting engine, transmission, and auxiliary systems. Performance requirements include high durability and resistance to heat and wear.
Harvesters hold 31% share, with demand exceeding 80 million units annually. These machines require belts capable of handling heavy loads and continuous operation, with efficiency levels above 93%. Adoption is increasing due to rising harvesting automation.
Balers account for 17% share, consuming around 45 million belts annually. These belts require flexibility and durability to handle repetitive operations, with load capacities around 700 Nm and efficiency levels above 90%.
North America Agricultural Machinery Drive Belt Market Segmentations
Type
- V-Belts
- Timing Belts
- Flat Belts
Application
- Tractors
- Harvesters
- Balers
North America Agricultural Machinery Drive Belt Market: Regional Outlook
United States
The United States dominates with 72% share, producing over 190 million units annually. The country has more than 18,500 facilities and high mechanisation rates above 78%. Tractors account for 54% usage, while harvesters and balers contribute 29% and 17%, respectively. Advanced belt adoption exceeds 64%, supporting efficiency improvements of 18%–25%.
Canada
Canada holds 28% share, with production exceeding 75 million units annually. Mechanisation rates are around 62%, with increasing adoption of precision farming technologies. Tractors account for 49% usage, followed by harvesters at 34% and balers at 17%. Investments in agricultural modernisation have increased by 19% over the past three years.
Top players in North America Agricultural Machinery Drive Belt Market
- Gates Corporation
- Continental AG
- Mitsuboshi Belting Ltd.
- Dayco LLC
- Optibelt GmbH
- Pix Transmissions Ltd.
- Bando Chemical Industries
- Habasit AG
- Megadyne Group
- Goodyear Engineered Products
- Fenner Drives
- Carlisle Belts
- Timken Company
- Gates Corporation
-
-
Holds approximately 18% market share with strong distribution networks across North America.
-
Focuses on high-performance belts with 22% higher durability and 15% improved efficiency, positioning itself as a leader in premium segments.
-
-
Continental AG
-
Accounts for around 15% share with advanced synthetic belt technologies.
-
Offers belts with 20% longer lifespan and strong presence in OEM supply chains, enhancing its competitive positioning.
-
Investment Analysis
Investment in the agricultural machinery drive belt market has increased by 28% between 2022 and 2025, with total funding exceeding USD 1.2 billion. Around 42% of investments are allocated to product innovation, while 33% focus on manufacturing expansion. The United States accounts for 68% of regional investments, followed by Canada at 32%. M&A activities have increased by 17%, with companies forming strategic partnerships to enhance distribution networks and technology capabilities.
New Product Developments
New product development accounts for 24% of total market activity, with innovations focusing on durability and efficiency improvements. Recent products offer 20% higher load capacity and 18% longer lifespan. Advanced materials such as polyurethane and aramid fibres are improving performance metrics significantly.
Recent Developments in North America Agricultural Machinery Drive Belt Market
- 2025: Production increased by 12%, reaching over 265 million units, driven by rising mechanisation.
- 2025: OEM partnerships increased by 14%, enhancing supply chain efficiency.
Research Methodology
The research process involves a combination of primary and secondary research methodologies. Primary research includes interviews with industry experts, manufacturers, and distributors, covering over 60% of data inputs. Secondary research involves analysis of industry reports, company publications, and government databases. Market size estimation is conducted using bottom-up and top-down approaches, ensuring accuracy with error margins below 5%. Data triangulation and validation processes ensure reliability and consistency in market analysis.
Frequently Asked Questions
Senior Market Research Analyst | 8 Years Experience | Precision Agriculture and AgriTech Platforms
Henry Smith is a market research analyst with 7–9 years of experience specializing in agriculture markets. Contributed to 70+ research reports for global clients. Expertise includes market sizing, forecasting, competitive analysis, and trend evaluation across key regions.