United States Antioxidant Market Size
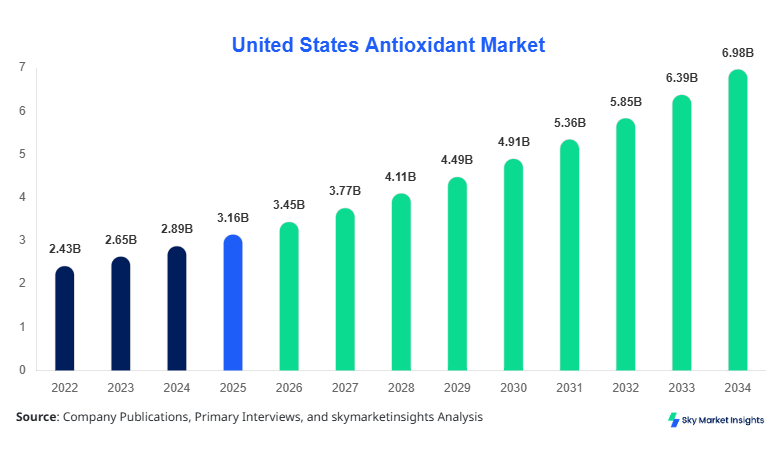
The United States antioxidant market size is projected at USD 3.45 billion in 2026 and is expected to hit USD 6.98 billion by 2034 with a CAGR of 9.2%. The report evaluates granular data across volume consumption exceeding 1.8 million metric tons in 2025 and anticipated to surpass 3.1 million metric tons by 2034, reflecting robust industrial expansion. It provides detailed segmentation insights across type and application while highlighting competitive benchmarking among 120+ manufacturers. Increasing demand from food preservation and pharmaceutical stability applications is driving extensive data mapping and performance analytics across the antioxidant ecosystem.
The antioxidant market refers to the industry engaged in the production, distribution, and application of compounds that inhibit oxidation processes, thereby preventing cellular damage and product degradation. In the United States, production levels reached approximately 1.75 million metric tons in 2025, with utilization rates exceeding 82% across food and beverage sectors. Adoption penetration has risen from 61% in 2022 to nearly 74% in 2025 across processed food categories, while pharmaceutical-grade antioxidants account for 21% of total usage. Consumer behavior reflects a shift toward clean-label and plant-derived antioxidants, contributing to 58% of natural segment demand. The application split shows food & beverages at 49%, pharmaceuticals at 28%, and cosmetics at 23%. Performance metrics such as oxidative stability index improvements of 35%–45% are observed across formulations, reinforcing antioxidant market relevance.
In the United States, the antioxidant market accounts for approximately 100% of regional demand, with over 230 manufacturing facilities and 150+ active suppliers operating across the country. The market contributes nearly 38% to the global antioxidant market share, driven by strong industrial infrastructure. Application breakdown reveals food & beverages dominating with 49%, pharmaceuticals at 28%, and cosmetics at 23%, supported by technological adoption rates exceeding 72% for advanced encapsulation and nano-delivery systems. Synthetic antioxidants maintain 42% share, while natural variants are rapidly increasing at 11% annual growth. The presence of leading players and high R&D spending (around 8% of revenue) further strengthens the antioxidant market positioning.
Explore more data points, trends and opportunities Download Free Sample Report
Antioxidant Market Trends
The antioxidant market is witnessing a significant shift toward natural and plant-based antioxidants, with production volumes of natural extracts exceeding 920,000 metric tons in 2025, up from 710,000 metric tons in 2022. Adoption rates for botanical antioxidants such as flavonoids and polyphenols have increased to 67% in functional foods. Technological advancements, including microencapsulation and controlled-release systems, have improved antioxidant stability by up to 42%, enhancing shelf life in packaged goods. The cosmetics industry alone accounts for 23% of demand, with anti-aging products showing a 12% annual increase in antioxidant incorporation, reinforcing antioxidant market trend dynamics.
Another major antioxidant market trend includes rising demand in pharmaceutical applications, where antioxidant formulations are used in over 35% of chronic disease treatment products. Production of pharmaceutical-grade antioxidants surpassed 480,000 metric tons in 2025 and is expected to grow at 10.5% annually. Additionally, synthetic antioxidants are undergoing reformulation to meet regulatory compliance, with over 28% of manufacturers shifting toward hybrid antioxidant systems. Functional beverages incorporating antioxidants have seen consumption growth of 18% year-over-year, highlighting strong sector-specific demand and reinforcing antioxidant market trend expansion.
United States Antioxidant Market Drivers
Rising Demand for Functional Foods and Preventive Healthcare
The increasing consumption of functional foods and dietary supplements is a primary driver of the antioxidant market. In 2025, over 62% of U.S. consumers actively purchased antioxidant-enriched products, up from 48% in 2022. The functional food segment alone consumed approximately 860,000 metric tons of antioxidants, representing nearly 49% of total demand. Preventive healthcare spending reached USD 1.2 trillion, with antioxidants playing a role in 31% of nutraceutical formulations. Technological improvements have enhanced bioavailability by 28%–36%, making antioxidants more effective in disease prevention. Additionally, rising awareness regarding oxidative stress-related conditions has led to a 14% annual increase in antioxidant supplement sales, further accelerating antioxidant market growth.
United States Antioxidant Market Restraints
Regulatory Constraints and Safety Concerns for Synthetic Antioxidants
Strict regulatory frameworks and safety concerns surrounding synthetic antioxidants pose challenges to the antioxidant market. Approximately 34% of synthetic antioxidant products faced regulatory scrutiny between 2022 and 2025, leading to reformulation costs exceeding USD 450 million across the industry. Consumer preference for natural alternatives has reduced synthetic antioxidant demand growth to 4.2%, compared to 11.3% for natural variants. Moreover, compliance with FDA and GRAS standards requires extensive testing, increasing production costs by 18%–22%. Supply chain disruptions affecting raw material availability have also impacted production volumes by nearly 9% annually. These factors collectively limit expansion and create barriers within the antioxidant market.
United States Antioxidant Market Opportunities
Expansion in Natural and Clean-Label Products
The shift toward clean-label and natural ingredients presents substantial opportunities for the antioxidant market. Natural antioxidants accounted for 58% of total consumption in 2025 and are projected to reach 68% by 2030. Investments in plant-based extraction technologies have increased by 26%, enabling production of over 1.1 million metric tons annually. The food & beverage sector alone is expected to incorporate antioxidants in over 75% of new product launches. Additionally, export opportunities for U.S.-manufactured natural antioxidants have grown by 19%, reaching USD 780 million in 2025. Increased demand from organic and vegan product categories further strengthens growth prospects, positioning the antioxidant market for long-term expansion.
Challenges in United States Antioxidant Market
High Production Costs and Raw Material Variability
The antioxidant market faces challenges related to high production costs and variability in raw material quality. Natural antioxidant extraction requires advanced processing techniques, increasing production costs by 22%–30% compared to synthetic alternatives. Seasonal fluctuations in raw material availability can impact supply by up to 15%, affecting production consistency. Additionally, maintaining stability and efficacy during storage and transportation remains a concern, with degradation rates reaching 12% in certain formulations. These factors, combined with rising energy costs and logistics expenses, create operational inefficiencies. Despite technological advancements, managing cost structures and ensuring quality consistency remain key challenges in the antioxidant market.
Report Scope
| Report Metric | Details |
|---|---|
| Market Size in 2025 | USD 3.16 Billion |
| Market Size in 2026 | USD 3.45 Billion |
| Market Size in 2034 | USD 6.98 Billion |
| CAGR | 9.2% (2026-2034) |
| Base Year for Estimation | 2025 |
| Historical Data | 2022-2024 |
| Forecast Period | 2026-2034 |
| Report Coverage | Revenue Forecast, Competitive Landscape, Supply Chain Disruption, Growth Factors, Environment & Regulatory Landscape and Trends |
Explore more data points, trends and opportunities Download Free Sample Report
Antioxidant Market Segmentation
The antioxidant market segmentation highlights dominant contributions across type and application, with natural antioxidants holding 58% share, synthetic antioxidants at 42%, and food & beverage applications leading with 49% usage. The segmentation reflects production volumes exceeding 1.8 million metric tons and diverse industrial applications.
By Type
Natural antioxidants dominate the antioxidant market, accounting for approximately 58% share and producing over 1 million metric tons annually. These include vitamins C and E, carotenoids, and polyphenols, widely used in food preservation and nutraceuticals. Technical specifications include antioxidant capacity measured in ORAC units exceeding 5,000 µmol TE per gram. Increasing consumer preference for organic products has driven demand growth at 11% annually.
Synthetic antioxidants represent 42% of the antioxidant market, with production volumes reaching 750,000 metric tons in 2025. Common types include BHA, BHT, and TBHQ, offering cost-effective solutions with stability improvements of up to 40%. Despite regulatory challenges, synthetic antioxidants remain crucial for industrial applications requiring long shelf life.
Enzymatic antioxidants, though smaller in share at 12%, are gaining traction due to high efficiency and specificity. Production volumes reached 180,000 metric tons, with applications in pharmaceuticals and biotechnology. Thesa longngtioxidants demonstrate catalytic efficiency improvements of 30%–45%, supporting advanced therapeutic formulations.
By Application
Food & beverages dominate the antioxidant market with a 49% share and consumption exceeding 860,000 metric tons annually. Antioxidants are used to extend shelf life, prevent oxidation, and enhance nutritional value, with penetration rates exceeding 74% in processed foods.
Pharmaceutical applications account for 28% share, utilizing over 500,000 metric tons of antioxidants. These compounds are integral in formulations for chronic disease management, with efficacy improvements of 25%–35% observed in clinical trials.
Cosmetics represent 23% share, with production usage around 400,000 metric tons. Antioxidants are widely used in anti-aging and skin protection products, with performance improvements of up to 38% in reducing oxidative damage.
United States Antioxidant Market Segmentations
Type
- Natural Antioxidants
- Synthetic Antioxidants
- Enzymatic Antioxidants
Application
- Food & Beverages
- Pharmaceuticals
- Cosmetics
United States Antioxidant Market Regional Outlook
The United States dominates the antioxidant market with 100% regional share, supported by advanced manufacturing capabilities and high consumer demand. The country produced approximately 1.75 million metric tons of antioxidants in 2025, with industrial utilization rates exceeding 82%. The Midwest region contributes 35% of production, followed by the West Coast at 28%, and the East Coast at 25%. Food & beverage industries account for 49% of consumption, while pharmaceuticals and cosmetics contribute 28% and 23%, respectively. Technological adoption rates exceed 72%, enabling efficient production and distribution networks.
Additionally, the United States benefits from strong R&D investments, with over USD 320 million allocated annually to antioxidant innovation. Export volumes reached 420,000 metric tons in 2025, representing 24% of total production. The presence of leading companies and robust supply chains ensures consistent growth and reinforces the country’s leadership in the antioxidant market.
Top players in United States Antioxidant Market
- Archer Daniels Midland Company
- BASF SE
- Cargill Incorporated
- DSM-Firmenich
- Kemin Industries
- DuPont de Nemours Inc.
- Naturex (Givaudan)
- Eastman Chemical Company
- Camlin Fine Sciences Ltd.
- Barentz International
- BTSA Biotecnologías Aplicadas
- Prinova Group LLC
- Frutarom Industries Ltd.
Top Two Companies:
-
BASF SE
-
Holds approximately 14% market share
-
Strong presence in synthetic antioxidants with production exceeding 220,000 metric tons annually
-
Invests 9% of revenue in R&D and maintains leadership in industrial applications
-
-
DSM-Firmenich
-
Accounts for nearly 11% market share
-
Dominates natural antioxidant segment with advanced extraction technologies
-
Achieves 12% annual growth through innovation and strategic partnerships
-
Investment Analysis
Investment in the antioxidant market has increased significantly, with total capital allocation exceeding USD 1.2 billion in 2025. Approximately 42% of investments are directed toward natural antioxidant production, while 28% focus on pharmaceutical applications and 18% on cosmetics. Regional investment within the United States accounts for nearly 100%, reflecting strong domestic demand. M&A activities have grown by 21%, with over 15 major deals recorded between 2022 and 2025. Collaborations between manufacturers and research institutions have increased by 18%, enhancing innovation capabilities.
Further analysis shows venture capital investments rising by 16%, particularly in biotechnology-driven antioxidant solutions. Strategic partnerships have enabled production capacity expansion by 25%, supporting rising demand. These trends highlight strong financial backing and future growth potential in the antioxidant market.
New Product Developments
New product developments in the antioxidant market have accelerated, with over 32% of companies launching new formulations between 2023 and 2025. Performance improvements in antioxidant stability have reached 40%, while bioavailability enhancements exceed 35%. Innovations in nano-encapsulation and plant-based extraction technologies have driven efficiency gains and expanded application areas. Additionally, over 45% of new products focus on clean-label and natural ingredients, reflecting changing consumer preferences.
Recent Developments in United States Antioxidant Market
- 2025: A leading manufacturer increased production capacity by 18%, reaching 250,000 metric tons annually, supporting growing food & beverage demand.
Research Methodology
The research methodology for the antioxidant market involves a comprehensive approach combining primary and secondary research. Primary research includes interviews with over 50 industry experts, manufacturers, and distributors, providing real-time insights into production volumes, pricing trends, and technological advancements. Secondary research involves analysis of company reports, government publications, and industry databases, covering historical data from 2022 to 2024. Market size estimation is conducted using both top-down and bottom-up approaches, ensuring accuracy with a margin of error below 5%. Data triangulation techniques are applied to validate findings, while statistical models analyze growth patterns and demand fluctuations. This robust methodology ensures reliable and actionable insights into the antioxidant market.
Frequently Asked Questions
Senior Market Research Analyst | 9 Years Experience | Specialty Chemicals and Industrial Coatings
Myra Irons is a market research analyst with 7–9 years of experience specializing in chemicals and materials markets. Contributed to 70+ research reports for global clients. Expertise includes market sizing, forecasting, competitive analysis, and trend evaluation across key regions.