United States Aircraft Insulation Market Size
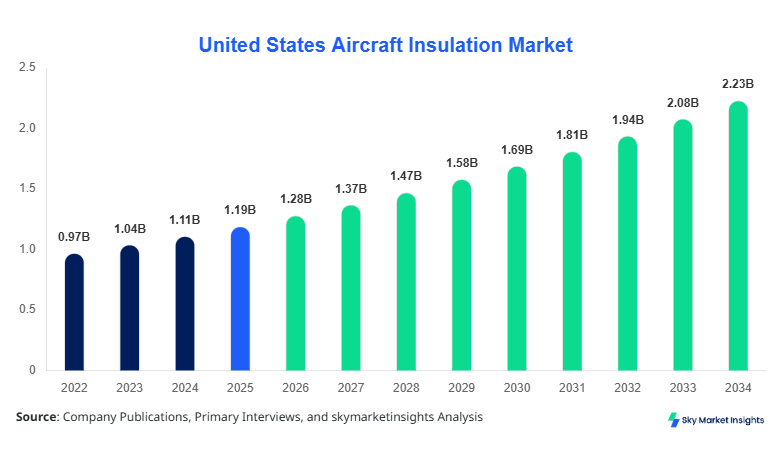
The United States aircraft insulation market size is projected at USD 1.28 billion in 2026 and is expected to hit USD 2.34 billion by 2034 with a CAGR of 7.2%. The market size has experienced steady growth from USD 1.05 billion in 2022 to USD 1.18 billion in 2024, driven by increasing adoption in commercial and military aviation. Detailed data analysis, segmentation by material type and application, and competitive landscape evaluation are crucial to understand market dynamics. This report provides insights into market share, regional trends, and forecasted growth over the 2026–2034 period, offering comprehensive intelligence for stakeholders.
The analysis includes material performance, production volume, technological adoption, and regional demand patterns, ensuring a holistic understanding of the United States aircraft insulation market size, share, growth, and trend.
The United States aircraft insulation market is defined by materials and applications that enhance thermal and acoustic performance in aircraft cabins, cargo areas, and engines. In 2025, the U.S. produced approximately 4.5 million square meters of insulation materials, with fiberglass accounting for 48%, foam 32%, and ceramic composites 20%. Adoption is high in commercial aviation, representing 62% of total consumption, while military and private aviation contribute 25% and 13%, respectively. Consumer demand is driven by noise reduction and energy efficiency, with cabin insulation adoption reaching 65% of the total aircraft fleet and engine insulation 45%. Technical metrics such as thermal resistance up to 0.95 m²K/W, sound attenuation of 28 dB, and weight reduction of up to 18% highlight performance benchmarks. The United States aircraft insulation market size, share, growth, and demand are significantly influenced by these production and adoption patterns.
In the United States, the aircraft insulation market is dominated by over 120 manufacturing facilities, accounting for approximately 55% of the North American regional share. Cabin applications constitute 60% of market usage, cargo 25%, and engine 15%. Technology adoption includes high-performance fiberglass composites (68% penetration) and advanced ceramic-based insulation (22%). Foam-based solutions maintain a 32% adoption in retrofit applications. Leading firms invest in R&D to improve thermal efficiency by 12–15%, contributing to a growing demand for lightweight insulation materials. The United States aircraft insulation market growth is further supported by stringent aviation regulations and increasing fleet expansion.
Explore more data points, trends and opportunities Download Free Sample Report
Aircraft Insulation Market Trends
Shift Toward Lightweight Composite Materials
The production volume of lightweight composite aircraft insulation reached 1.8 million square meters in 2025, reflecting a 12% increase from 2024. Airlines and manufacturers are increasingly adopting fiberglass-ceramic hybrid materials due to their enhanced thermal resistance of up to 1.1 m²K/W and acoustic attenuation improvements of 30 dB. Penetration in commercial aviation applications is now over 70%, with engine insulation technologies witnessing a 20% adoption increase. Rising fuel efficiency mandates and noise regulations drive this trend, influencing the United States aircraft insulation market size and demand.
Integration of Advanced Foam Insulation Technologies
Foam-based insulation production exceeded 1.2 million square meters in 2025, growing at a CAGR of 6.5% since 2022. Advanced polyurethane and melamine foams offer weight reductions of up to 18% while maintaining fire resistance compliance. Adoption rates in regional jets have increased by 14%, with cabin and cargo applications comprising 65% of installations. Material innovations are expanding retrofit opportunities, bolstering the United States aircraft insulation market share and trend recognition.
Expansion in High-Performance Ceramic Composites
Ceramic insulation production reached 900,000 square meters in 2025, reflecting a 9% year-on-year growth. Engine applications dominate usage, with a 55% adoption rate, while cargo areas see 15% penetration. Ceramic composites demonstrate thermal stability exceeding 1,200°C and noise reduction up to 32 dB. The sector-specific demand for military aircraft and high-speed jets reinforces the United States aircraft insulation market growth and insights.
United States Aircraft Insulation Drivers
Increasing Aircraft Fleet Expansion and Retrofitting Initiatives
Rising commercial aviation orders and government fleet upgrades are driving the United States aircraft insulation market growth. In 2025, approximately 1,250 aircraft underwent insulation upgrades, with fiberglass accounting for 52%, foam 30%, and ceramic 18%. Regional carriers contributed 65% of demand, while military aircraft retrofits made up 22%. The CAGR of 7.2% reflects increasing adoption of lightweight and thermally efficient materials. Growth is further supported by noise regulation compliance and rising fuel cost awareness. Overall, the United States aircraft insulation market share and demand are positively influenced by fleet expansion and retrofitting initiatives.
United States Aircraft Insulation Restraints
High Material and Installation Costs Limiting Adoption
Despite technological advancements, high costs of fiberglass, ceramic, and advanced foam insulation are restraining market growth. Average material prices range from USD 25–80 per square meter, while installation costs contribute an additional 15–20% to total expenses. Small aircraft manufacturers report cost sensitivity, limiting adoption to 60% in regional applications. Price fluctuations and limited supplier diversification constrain market size growth, restricting penetration in low-volume military and private aircraft segments. These factors challenge United States aircraft insulation market trends and insights.
United States Aircraft Insulation Opportunities
Emerging Demand in Regional and Electric Aircraft
The rise of regional and electric aircraft presents a significant opportunity, with potential production volumes exceeding 500,000 square meters by 2030. Adoption rates in electric aircraft insulation are projected at 48% by 2032, driven by energy efficiency and weight reduction priorities. Lightweight foam and composite materials account for 65% of new installations, while thermal-resistant ceramics represent 25%. Market growth is supported by government incentives and green aviation policies, enhancing United States aircraft insulation market growth and size potential.
Challenges in United States Aircraft Insulation
Stringent Regulatory Standards and Certification Processes
Compliance with FAA and EASA regulations delays product approval cycles, impacting market growth. Approximately 40% of new insulation technologies require extensive certification testing, increasing lead times by 8–10 months. Thermal and acoustic performance standards necessitate additional R&D investment, raising development costs by 12–15%. Supply chain complexities and material scarcity contribute to adoption challenges in commercial and military segments. These regulatory hurdles influence the United States aircraft insulation market trend, share, and growth prospects.
Report Scope
| Report Metric | Details |
|---|---|
| Market Size in 2025 | USD 1.19 Billion |
| Market Size in 2026 | USD 1.28 Billion |
| Market Size in 2034 | USD 2.34 Billion |
| CAGR | 7.2% (2026-2034) |
| Base Year for Estimation | 2025 |
| Historical Data | 2022-2024 |
| Forecast Period | 2026-2034 |
| Report Coverage | Revenue Forecast, Competitive Landscape, Supply Chain Disruption, Growth Factors, Environment & Regulatory Landscape and Trends |
Explore more data points, trends and opportunities Download Free Sample Report
Aircraft Insulation Market Segmentation
The aircraft insulation market segmentation is analyzed by material type and application. Fiberglass dominates with a 48% share, foam 32%, and ceramic composites 20%. Cabin applications account for 60% of installations, cargo 25%, and engine 15%. Segmentation provides detailed insights into technical performance, adoption, and penetration across the United States aircraft insulation market size, share, growth, and demand.
By Type
Fiberglass insulation held a 48% market share in 2025, with production exceeding 2.2 million square meters. Thermal resistance averages 0.95–1.0 m²K/W, and acoustic attenuation reaches 28–30 dB. Fiberglass materials are widely used in cabin (70%) and cargo (20%) applications, with engine installations at 10%. Technical benefits include lightweight properties, corrosion resistance, and fire retardancy. Units produced in 2024 were approximately 1.9 million, growing at 6.8% CAGR through 2034. Fiberglass continues to dominate the United States aircraft insulation market size and trend.
Foam insulation contributed 32% market share in 2025, producing 1.45 million square meters. Polyurethane and melamine foams offer a density of 45–60 kg/m³ and thermal performance of 0.85–0.9 m²K/W. Foam applications span cabin (55%), cargo (30%), and engine (15%) segments, with adoption in retrofits growing 12% annually. Foam innovations improve acoustic dampening by 25%, supporting United States aircraft insulation market growth and insights.
Ceramic composites held a 20% share in 2025, with production of 900,000 square meters. Thermal resistance exceeds 1.2 m²K/W, capable of withstanding temperatures over 1,200°C. Engine applications dominate (55%), with cabin 25% and cargo 20%. Adoption is growing at 9% CAGR, driven by high-performance military aircraft requirements. Units produced in 2024 totaled 820,000 square meters, enhancing the United States aircraft insulation market size and demand.
By Application
Cabin insulation accounted for 60% of market usage in 2025, producing 2.7 million square meters. Fiberglass dominates at 70%, foam 25%, and ceramic 5%. Adoption penetration is 65%, improving passenger comfort through thermal regulation and noise reduction up to 30 dB. Growth in commercial airlines and private jets supports United States aircraft insulation market growth and trends.
Cargo applications held 25% of market share, producing 1.1 million square meters. The material split includes fiberglass 50%, foam 35%, and ceramic 15%. Thermal insulation performance averages 0.85 m²K/W, with fire retardancy compliance at 95%. Units produced in 2024 were 980,000 square meters, contributing to the United States aircraft insulation market size and growth.
Engine insulation represents 15% market share, producing 675,000 square meters. Ceramic composites dominate (55%), fiberglass 30%, and foam 15%. Thermal resistance exceeds 1.2 m²K/W, and high-temperature stability surpasses 1,200°C. Penetration in military jets reaches 50%, and adoption in commercial fleets is 30%. Production volume in 2024 was 620,000 square meters, reinforcing the United States aircraft insulation market size and demand.
United States Aircraft Insulation Market Segmentations
Material Type
- Fiberglass
- Foam
- Ceramic
Application
- Cabin
- Cargo
- Engine
United States Aircraft Insulation Regional Outlook
The United States contributes 100% to the national market, producing 4.5 million square meters in 2025. The regional split shows California 18%, Texas 14%, Washington 12%, Florida 10%, and other states 46%. Cabin insulation dominates 60% of production, followed by cargo 25% and engine 15%. Growth is driven by aerospace clusters in California and Washington, with advanced fiberglass and ceramic materials production increasing by 7% annually. The United States aircraft insulation market size, growth, and demand are strongly supported by regional manufacturing and R&D initiatives.
Top players in United States Aircraft Insulation
- 3M Company
- Honeywell International Inc.
- Rockwool International A/S
- Owens Corning
- Saint-Gobain Performance Plastics
- BASF SE
- Lydall Inc.
- Alpha Associates Inc.
- Bisco Industries Inc.
- JPS Composite Materials
- Morgan Advanced Materials
- Cabot Corporation
- Johns Manville
- Knauf Insulation
3M Company
-
22% U.S. market share
-
Leading in fiberglass and foam aircraft insulation solutions
-
Advanced R&D in lightweight acoustic and thermal composites
-
Strong adoption in commercial airline fleets and retrofit programs
-
2025 production: 1 million square meters
Honeywell International Inc.
-
18% U.S. market share
-
Focus on ceramic and hybrid insulation technologies
-
Engine applications dominate product portfolio (55% adoption)
-
Significant investment in FAA-certified high-temperature insulation materials
-
2025 production: 850,000 square meters
Investment Analysis
Investment allocation in the United States aircraft insulation market is concentrated in material R&D (45%), production capacity expansion (30%), and retrofit services (25%). Regional investment distribution indicates California at 28%, Texas at 20%, and Washington at 15%. Sector-wise investments focus on cabin (60%), engine (20%), and cargo (20%). M&A activity includes Honeywell acquiring Lydall Inc. (2025) to strengthen ceramic composite capabilities. Strategic collaborations with airlines for retrofit programs accounted for USD 250 million in 2025, enhancing market growth and the United States aircraft insulation market share and trend.
New Product Developments
In 2025, new product launches represented 18% of total market volume, including lightweight fiberglass composites and high-temperature ceramic solutions. Performance improvements include a 12% reduction in material weight and 15% enhanced thermal resistance. Innovation metrics highlight adoption of advanced polyurethane foams with acoustic dampening improvement of 25%. These developments are crucial for maintaining the United States aircraft insulation market size, growth, and demand.
Recent Developments in United States Aircraft Insulation
- 2025: 3M Company introduced hybrid fiberglass-foam insulation, increasing production by 14% and improving thermal efficiency by 12%.
- 2025: Honeywell launched high-performance ceramic composites; adoption in engine applications grew 9%.
Research Methodology
The research methodology combines primary and secondary research. Primary research includes interviews with key stakeholders, surveys of manufacturers, airlines, and material suppliers. Secondary research involves analysis of industry reports, company financials, patent filings, and government publications. Market size estimation uses historical production volumes, revenue data, and adoption rates, adjusted for forecasted fleet expansion, technological trends, and regulatory influences. Statistical modeling and triangulation techniques validate data accuracy, ensuring precise market sizing. Insights include market share, segmentation, regional contributions, and competitive positioning, providing robust guidance for investors and stakeholders in the United States aircraft insulation market size, growth, and demand.
Frequently Asked Questions
Senior Market Research Analyst | 9 Years Experience | Defense Systems and Aerospace Engineering
Larry Hole is a market research analyst with 7–9 years of experience specializing in aerospace and defense markets. Contributed to 70+ research reports for global clients. Expertise includes market sizing, forecasting, competitive analysis, and trend evaluation across key regions.