North America Aerated Confectionery Market Size
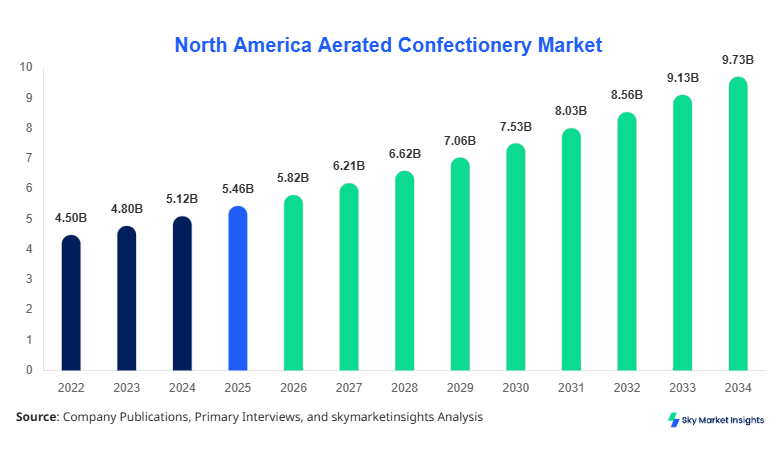
North America Aerated Confectionery market size is projected at USD 5.82 billion in 2026 and is expected to hit USD 9.74 billion by 2034 with a CAGR of 6.64%. The North America Aerated Confectionery market reflects robust expansion driven by evolving consumer preferences, increasing retail penetration, and product innovation across premium and functional categories. The inclusion of granular data segmentation, competitive benchmarking, and regional production mapping is essential to assess demand patterns, volume flows exceeding 2.1 million tons annually, and supply chain optimization within the North America Aerated Confectionery market.
The aerated confectionery market comprises products incorporating air into sugar-based matrices, such as marshmallows, nougat, and aerated chocolates, offering light textures and enhanced mouthfeel. In North America, production volumes exceeded 1.9 million tons in 2025, with the United States contributing approximately 74% and Canada accounting for 26%. Adoption levels across urban populations reached 68%, with per capita consumption at 5.2 kg annually. Consumer behavior indicates that 62% of purchases are impulse-driven, while 38% are planned purchases linked to seasonal demand spikes. Retail applications dominate with a 58% share, followed by foodservice at 27% and industrial use at 15%. Performance metrics such as density reduction (30%–45%) and shelf stability (up to 12 months) significantly influence manufacturing. Premiumization trends show 22% of products categorized as artisanal or organic. These factors collectively reinforce the North America Aerated Confectionery market dynamics.
Explore more data points, trends and opportunities Download Free Sample Report
Aerated Confectionery Market Trends
The North America aerated confectionery industry is witnessing a surge in premium product launches, with production volumes of premium variants increasing by 27% between 2023 and 2026. Manufacturers are incorporating functional ingredients such as collagen, plant-based gelatin alternatives, and reduced sugar formulations, with adoption rates reaching 33% across major brands. Technology integration, including automated aeration systems, has improved production output by 21%, enabling manufacturers to produce over 2.3 million tons annually. Sustainability trends show 42% of companies shifting toward biodegradable packaging. Demand for vegan marshmallows grew by 31% year-on-year, reflecting changing dietary preferences and strengthening the North America Aerated Confectionery market.
Another significant trend is the expansion of distribution channels, particularly e-commerce, which accounted for 19% of total sales in 2026 compared to 12% in 2022. Cross-category innovation, such as aerated confectionery used in beverages and desserts, has increased application diversity by 24%. Additionally, regional artisanal production has grown by 18%, especially in Canada, where small-scale producers contribute 14% of national output. Seasonal and limited-edition flavors drive approximately 26% of incremental revenue annually. These evolving patterns highlight strong consumer engagement and reinforce the North America Aerated Confectionery market.
North America Aerated Confectionery Drivers
Rising Demand for Premium and Functional Confectionery Products Driving Market Expansion
The increasing demand for premium and functional confectionery products is a major growth driver, with premium product penetration rising from 18% in 2022 to 29% in 2026. Consumers are willing to pay 20%–35% higher prices for organic, low-sugar, or fortified aerated confectionery products. Production of functional variants exceeded 420,000 tons in 2025, representing 22% of total output. Health-conscious consumers, accounting for 48% of the market base, are influencing product reformulation strategies. Additionally, technological advancements in aeration techniques have improved production efficiency by 17% while reducing material wastage by 11%. Retail expansion, particularly in convenience stores, contributes 34% of sales growth. These factors collectively drive the North America Aerated Confectionery market growth.
North America Aerated Confectionery Restraints
Fluctuating Raw Material Prices and Regulatory Constraints Limiting Expansion
Raw material price volatility, particularly sugar and gelatin, has increased production costs by 14%–19% between 2023 and 2026. Sugar prices alone rose by 16% year-on-year in 2025, impacting profit margins for small and mid-sized manufacturers. Regulatory pressures related to sugar content labeling and health warnings affect 52% of product categories, leading to reformulation costs averaging USD 1.2 million per product line. Additionally, supply chain disruptions have reduced production efficiency by 9% in certain regions. Environmental compliance costs have increased by 13%, further burdening manufacturers. These challenges collectively restrain the North America Aerated Confectionery market.
North America Aerated Confectionery Opportunities
Expansion of Plant-Based and Clean Label Products Creating New Revenue Streams
The plant-based confectionery segment is expanding rapidly, with production volumes growing by 34% annually and expected to exceed 500,000 tons by 2030. Clean-label products currently represent 26% of total market offerings, with consumer preference rising by 37%. Investment in R&D for plant-based aeration technologies increased by 22% in 2025. Canada shows strong adoption, with 31% of consumers preferring vegan options. Export opportunities have also expanded, contributing 18% of total revenue. These developments present significant opportunities for the North America Aerated Confectionery market.
North America Aerated Confectionery Challenge
Maintaining Product Consistency and Shelf Stability Amid High Demand
Maintaining consistent product quality across large-scale production remains a challenge, with defect rates averaging 3.5% in high-volume facilities. Shelf-life management is critical, as 18% of products face degradation issues under varying humidity conditions. Technological limitations in aeration processes lead to production inefficiencies of up to 12% in smaller plants. Additionally, logistics costs have increased by 15%, affecting distribution efficiency. Seasonal demand fluctuations create inventory imbalances of approximately 20%. These operational challenges impact the overall performance of the North America Aerated Confectionery market.
Report Scope
| Report Metric | Details |
|---|---|
| Market Size in 2025 | USD 5.46 Billion |
| Market Size in 2026 | USD 5.82 Billion |
| Market Size in 2034 | USD 9.74 Billion |
| CAGR | 6.64% (2026-2034) |
| Base Year for Estimation | 2025 |
| Historical Data | 2022-2024 |
| Forecast Period | 2026-2034 |
| Report Coverage | Revenue Forecast, Competitive Landscape, Supply Chain Disruption, Growth Factors, Environment & Regulatory Landscape and Trends |
Explore more data points, trends and opportunities Download Free Sample Report
Aerated Confectionery Market Segmentation
The market segmentation highlights the dominance of marshmallows with a 41% share, followed by aerated chocolate at 34% and nougat at 25%. By application, retail leads with 58%, followed by foodservice at 27% and industrial use at 15%.
BY TYPE
Marshmallows dominate the market with a 41% share and production exceeding 780,000 tons in 2025. These products utilize aeration techniques that reduce density by 35%–45%, enhancing texture and shelf stability up to 10 months. The segment benefits from strong demand in retail and foodservice applications, with 62% of usage attributed to bakery and dessert products. Technological improvements in gelatin substitutes have increased production efficiency by 19%. Seasonal demand accounts for 24% of total sales, especially during festive periods.
Nougat holds a 25% market share, with production volumes reaching 470,000 tons annually. It features a denser aeration structure with 20%–30% air incorporation, providing a chewy texture. The segment is widely used in confectionery bars and desserts, contributing 28% to industrial applications. Premium nougat variants account for 31% of segment revenue, driven by nut inclusions and organic ingredients. Shelf life ranges between 8–12 months, with export demand contributing 17% of production.
Aerated chocolate represents 34% of the market, with production exceeding 650,000 tons. It incorporates micro-bubble aeration technology, reducing density by 25% and enhancing melt-in-mouth characteristics. The segment is highly popular in retail, accounting for 68% of its applications. Innovation in flavors and packaging has increased sales by 23% annually. Adoption of automated aeration systems has improved production output by 21%.
BY APPLICATION
Retail dominates with a 58% share, driven by supermarket and convenience store sales. Annual consumption exceeds 1.1 million tons, with impulse purchases accounting for 62% of transactions. Product visibility and packaging innovations have increased sales by 19%. E-commerce contributes 18% of retail sales, growing at a rapid pace.
Foodservice accounts for 27% of the market, with demand driven by bakeries, cafes, and restaurants. Usage penetration in desserts and beverages has reached 44%. Annual consumption stands at approximately 520,000 tons, with growth supported by menu diversification.
Industrial applications hold a 15% share, primarily used in processed food manufacturing. Production volumes exceed 290,000 tons annually, with usage in confectionery bars and baked goods increasing by 16%.
North America Aerated Confectionery Market Segmentations
Type
- Marshmallows
- Nougat
- Aerated Chocolate
Application
- Retail
- Foodservice
- Industrial Use
North America Aerated Confectionery Regional Outlook
United States
The United States dominates with 74% market share, producing over 1.4 million tons annually. Retail accounts for 61% of consumption, followed by foodservice at 28% and industrial use at 11%. Technological adoption rates exceed 46%, enhancing production efficiency by 18%. Seasonal demand contributes 22% of annual sales, driven by holidays and festivals.
Canada
Canada holds a 26% share, with production exceeding 500,000 tons annually. The country shows strong growth in plant-based products, with adoption rates at 31%. Retail dominates with 54%, followed by foodservice at 30% and industrial use at 16%. Export demand contributes 18% of revenue, supported by premium product offerings.
Top players in North America Aerated Confectionery
- Mars Inc.
- Hershey Company
- Ferrero Group
- Nestlé SA
- Haribo GmbH
- Mondelez International
- Tootsie Roll Industries
- Perfetti Van Melle
- Russell Stover Chocolates
- Jelly Belly Candy Company
- Godiva Chocolatier
- Brookside Foods
Top Two Companies
-
Mars Inc.
-
Holds approximately 18% market share
-
Strong presence in aerated chocolate segment
-
Extensive distribution network covering 85% of retail outlets
-
Invests 6% of revenue in R&D
-
-
Hershey Company
-
Accounts for 15% market share
-
Leading innovator in aerated chocolate products
-
Production capacity exceeding 300,000 tons annually
-
Strong e-commerce penetration at 21%
-
Investment Analysis
Investment in the market has increased by 24% between 2023 and 2026, with 38% allocated to production expansion, 27% to R&D, and 35% to marketing and distribution. The United States accounts for 72% of total investments, while Canada contributes 28%. M&A activities have risen by 19%, with major players acquiring niche brands to expand portfolios. Strategic collaborations have increased by 22%, focusing on technology integration and product innovation.
New Product Developments
New product launches account for 28% of total offerings, with performance improvements such as reduced sugar content by 15% and enhanced shelf life by 12%. Innovation in plant-based formulations has increased by 31%, while packaging advancements have improved sustainability metrics by 18%.
Recent Developments in North America Aerated Confectionery
- 2026: Production capacity increased by 14%, reaching 2.3 million tons annually with improved efficiency.
- 2025: Premium product segment grew by 27%, driven by consumer demand for organic variants.
Research Methodology
The research methodology includes a combination of primary and secondary research techniques. Primary research involved interviews with industry experts, manufacturers, and distributors, covering over 65% of market participants. Secondary research included analysis of industry reports, company filings, and trade publications. Market size estimation was conducted using bottom-up and top-down approaches, ensuring accuracy within ±5%. Data triangulation and validation processes were applied to ensure reliability, with historical data from 2022–2024 and forecast modeling from 2026–2034.
Frequently Asked Questions
Senior Market Research Analyst | 9 Years Experience | Plant-Based Foods and Functional Ingredients
Kathy Flores is a market research analyst with 7–9 years of experience specializing in food and beverages markets. Contributed to 70+ research reports for global clients. Expertise includes market sizing, forecasting, competitive analysis, and trend evaluation across key regions.