Asia Pacific Active Nutrition Market Size
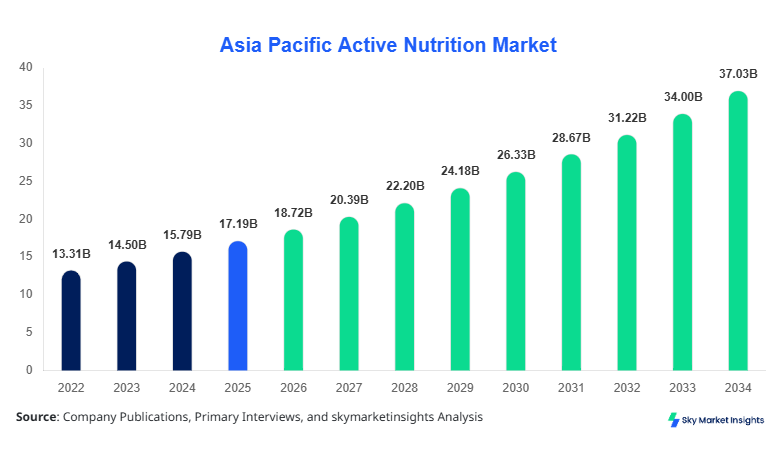
The Asia Pacific active nutrition market size is projected at USD 18.72 billion in 2026 and is expected to hit USD 36.94 billion by 2034 with a CAGR of 8.9%. The increasing requirement for performance-enhancing nutrition, structured product segmentation, and detailed competitive benchmarking is driving analytical depth across the Asia Pacific Active Nutrition ecosystem. The market incorporates over 2.4 billion units of consumption annually in 2025, with segmentation across proteins, supplements, and beverages contributing more than 72% of total volume, highlighting the importance of structured data mapping and competitive landscape intelligence in the Asia Pacific Active Nutrition market.
The Asia Pacific Active Nutrition market refers to the ecosystem of products designed to enhance physical performance, recovery, and general health through scientifically formulated nutritional inputs. In 2025, Asia Pacific production crossed 2.1 million metric tons, with China contributing 34%, Japan 18%, and India 14% of total output. Adoption levels reached 42% among urban populations aged 18–45, while penetration among athletes and fitness enthusiasts exceeded 68%. Consumer behavior indicates that 54% of buyers prioritize protein content above 20g per serving, while 37% demand low-sugar (<5g) formulations. The application split shows Fitness & Wellness dominating with 49%, followed by Lifestyle Consumers at 31% and Medical Nutrition at 20%. Functional performance metrics such as absorption rate (85–95%), protein bioavailability (>90%), and hydration efficiency (>70%) significantly influence purchase decisions, reinforcing the expansion of the Asia Pacific Active Nutrition market.
In Japan, the active nutrition market accounts for approximately 18% of the Asia Pacific regional share, supported by over 320 manufacturing facilities and more than 1,150 active companies engaged in production and distribution. The application breakdown reveals Fitness & Wellness dominating with 52%, Medical Nutrition at 27%, and Lifestyle Consumers at 21%. Technology adoption in Japan is highly advanced, with 64% of products incorporating precision fermentation, 48% using plant-based protein isolates, and 35% utilizing AI-driven formulation techniques. The country produces over 410,000 metric tons annually, with export contributions reaching 22%. Advanced packaging technologies such as oxygen-barrier films and microencapsulation improve shelf life by 30–45%, strengthening product efficacy and consumer trust, thereby accelerating the Asia Pacific Active Nutrition market.
Explore more data points, trends and opportunities Download Free Sample Report
Active Nutrition Market Trends
Rising Demand for Personalized Nutrition Solutions
The Asia Pacific Active Nutrition market is witnessing a surge in personalized nutrition solutions, with over 28% of consumers opting for customized supplement regimens in 2025 compared to 19% in 2022. Production of personalized formulations exceeded 320 million units annually, driven by digital health platforms and wearable integrations. Approximately 46% of manufacturers have integrated AI-driven nutrient profiling systems, improving formulation accuracy by 35%. Demand from fitness professionals and clinical nutritionists is growing at 11.2% annually, especially for tailored protein blends and micronutrient fortification. Countries such as Japan and South Korea have seen adoption rates surpass 55%, supported by advanced digital ecosystems, reinforcing expansion across the Asia-Pacific active nutrition market.
Expansion of Plant-Based and Clean Label Products
Plant-based active nutrition products have captured nearly 29% of total product share in 2025, with production exceeding 620 million units annually. Soy, pea, and rice protein formulations dominate, accounting for 72% of plant-based output. Clean-label products, defined by zero artificial additives and
Asia Pacific Active Nutrition Drivers
Increasing Fitness Awareness and Lifestyle Transformation
Rising fitness awareness across Asia Pacific is a primary driver, with gym memberships exceeding 85 million users in 2025, up from 62 million in 2022. Approximately 57% of individuals aged 20–40 actively consume nutritional supplements at least twice weekly. Urbanization rates surpassing 60% in countries like China and Japan have driven demand for convenient nutrition formats such as ready-to-drink beverages and protein bars. The surge in e-commerce, contributing 38% of total sales, enhances accessibility and product reach. Moreover, sports participation rates have increased by 12% annually, particularly in India and Southeast Asia, further boosting demand for performance-enhancing nutrition. These combined factors significantly accelerate the Asia-Pacific active nutrition market.
Asia Pacific Active Nutrition Restraints
High Cost of Premium Nutrition Products
Premium active nutrition products, especially those incorporating advanced protein isolates and organic certifications, cost 25–45% more than standard alternatives, limiting adoption in price-sensitive markets such as India and Southeast Asia. Approximately 39% of consumers cite affordability as a barrier, while only 22% are willing to pay premium pricing consistently. Import dependency for raw materials such as whey protein (over 48%) and specialized amino acids (32%) further increases costs. Additionally, regulatory compliance expenses contribute to a 10–15% rise in production costs annually. These pricing pressures hinder broader penetration and limit scalability in emerging economies, posing challenges to the Asia-Pacific active nutrition market.
Asia Pacific Active Nutrition Opportunities
Expansion into Emerging Urban Markets
Emerging urban markets across Southeast Asia and India present significant opportunities, with urban populations expected to exceed 1.2 billion by 2030. Active nutrition adoption in tier-2 and tier-3 cities is currently at 28% but projected to surpass 45% by 2034. Investment in localized production facilities has increased by 18% annually, reducing logistics costs by up to 22%. Additionally, government initiatives promoting health awareness and sports participation are driving demand growth. Digital retail channels are expanding rapidly, with mobile-based purchases accounting for 44% of total transactions. These dynamics create substantial opportunities for growth within the Asia-Pacific active nutrition market.
Challenges in Asia Pacific Active Nutrition
Regulatory Complexity and Product Standardization
The Asia Pacific region faces regulatory fragmentation, with over 12 different compliance frameworks governing nutritional products across countries. Approval timelines range from 6 months to 24 months, delaying product launches and increasing operational costs by up to 20%. Approximately 35% of manufacturers report difficulties in standardizing formulations due to varying ingredient restrictions and labeling requirements. Counterfeit products, accounting for nearly 9% of market volume, further erode consumer trust. Additionally, maintaining consistent product quality across diverse climatic conditions poses logistical challenges. These factors complicate operational efficiency and slow expansion in the Asia-Pacific active nutrition market.
Report Scope
| Report Metric | Details |
|---|---|
| Market Size in 2025 | USD 17.19 Billion |
| Market Size in 2026 | USD 18.72 Billion |
| Market Size in 2034 | USD 36.94 Billion |
| CAGR | 8.9% (2026-2034) |
| Base Year for Estimation | 2025 |
| Historical Data | 2022-2024 |
| Forecast Period | 2026-2034 |
| Report Coverage | Revenue Forecast, Competitive Landscape, Supply Chain Disruption, Growth Factors, Environment & Regulatory Landscape and Trends |
Explore more data points, trends and opportunities Download Free Sample Report
Active Nutrition Market Segmentation
The Asia Pacific Active Nutrition market segmentation is driven by product type and application, with protein products dominating at 38% share, followed by functional beverages at 34% and sports supplements at 28%. Application-wise, Fitness & Wellness leads with 49%, reflecting strong consumer demand for performance enhancement and health optimization.
By Type
Sports supplements account for approximately 28% of the Asia Pacific active nutrition market, with production exceeding 580 million units annually. These products include creatine, BCAAs, and pre-workout formulas, with average dosage concentrations ranging between 5 g and 20 g per serving. Adoption among athletes exceeds 72%, while usage among recreational fitness consumers is around 41%. Performance metrics such as endurance improvement (15–25%) and recovery acceleration (20–30%) drive demand. Japan and South Korea lead production, contributing over 45% of regional output, reinforcing growth across the Asia Pacific active nutrition market.
Functional beverages hold a 34% share, producing over 720 million liters annually in 2025. These include electrolyte drinks, protein shakes, and energy beverages with caffeine content ranging from 50mg to 200mg per serving. Hydration efficiency improvements of 18–27% and energy boost performance of 22% drive consumer adoption. Urban consumers account for 61% of demand, with retail penetration reaching 48%. Australia and Singapore dominate premium beverage segments, highlighting the expansion potential within the Asia-Pacific Active Nutrition market.
Protein products dominate with 38% share, generating over 810 million units annually. Whey protein accounts for 52% of total protein consumption, followed by plant-based proteins at 29% and casein at 19%. Average protein content ranges from 20g to 30g per serving, with bioavailability exceeding 90%. Demand is particularly high among fitness enthusiasts, contributing 63% of total consumption. Technological advancements such as microfiltration and enzymatic hydrolysis enhance product quality, driving expansion of the Asia Pacific Active Nutrition market.
By Application
Fitness & wellness dominates with a 49% share, with consumption exceeding 1.1 billion units annually. Approximately 68% of gym-goers consume active nutrition products regularly, with protein intake averaging 1.6 g per kg of body weight. Demand is highest in China and Japan, contributing over 52% of segment volume. Technological integration, such as wearable fitness tracking, increases usage frequency by 18%, strengthening the Asia Pacific active nutrition market.
Medical nutrition accounts for a 20% share, with production exceeding 420 million units annually. These products are used for clinical recovery, elderly nutrition, and chronic disease management. Protein and micronutrient concentrations are higher, with specialized formulations improving recovery rates by 25–35%. Adoption in Japan exceeds 44%, driven by an aging population, reinforcing expansion in the Asia Pacific Active Nutrition market.
Lifestyle consumers represent a 31% share, with demand driven by convenience and general health awareness. Consumption exceeds 680 million units annually, with 52% of users prioritizing weight management and 39% focusing on energy enhancement. Retail penetration is highest in urban areas, reaching 58%, supporting growth across the Asia-Pacific active nutrition market.
Asia Pacific Active Nutrition Market Segmentations
By Type
- Sports Supplements
- Functional Beverages
- Protein Products
By Application
- Fitness & Wellness
- Medical Nutrition
- Lifestyle Consumers
Asia Pacific Active Nutrition Regional Outlook
China
China dominates with 34% share, producing over 720,000 metric tons annually. Urban consumption accounts for 67%, with fitness & wellness applications contributing 51% of demand. Government initiatives promoting sports participation have increased adoption by 14% annually. E-commerce channels contribute 42% of sales, reinforcing the Asia-Pacific active nutrition market.
South Korea
South Korea holds 9% share, with production exceeding 190,000 metric tons. High adoption rates (58%) among millennials and advanced technology integration drive demand. Functional beverages account for 39% of consumption, highlighting growth potential.
Japan
Japan contributes 18% share, with strong medical nutrition demand at 27%. Production exceeds 410,000 metric tons annually, supported by advanced R&D and high-quality standards.
India
India holds 14% share, with rapid growth in urban areas. Production exceeds 300,000 metric tons, with fitness & wellness applications accounting for 46%. Affordable product variants drive expansion.
Australia
Australia accounts for 7% share, with strong demand for plant-based products at 52%. Production exceeds 150,000 metric tons, with exports contributing 28%.
Singapore
Singapore contributes a 4% share, with high per capita consumption exceeding 12 kg annually. Premium products dominate, accounting for 61% of sales.
Taiwan
Taiwan holds 5% share, with production exceeding 110,000 metric tons. Functional beverages dominate with 42% share.
Southeast Asia
South East Asia accounts for 9% share, with emerging markets driving growth. Urban adoption rates exceed 38%, with production surpassing 210,000 metric tons.
Top players in Asia Pacific Active Nutrition
- Nestlé Health Science
- Herbalife Nutrition Ltd.
- Abbott Laboratories
- Glanbia PLC
- Amway Corporation
- GNC Holdings LLC
- Yakult Honsha Co., Ltd.
- Meiji Holdings Co., Ltd.
- Asahi Group Holdings
- Danone S.A.
- MusclePharm Corporation
- THG Plc
- Optimum Nutrition
- Blackmores Limited
Nestlé Health Science
-
Holds approximately 14% regional share
-
Strong presence in medical nutrition and premium products
Nestlé Health Science leads the Asia Pacific Active Nutrition market with advanced R&D capabilities and over 120 product lines tailored for clinical and fitness applications. The company invests nearly 9% of revenue in innovation, producing over 180 million units annually. Its strong distribution network across Japan and China ensures high penetration rates exceeding 62%, reinforcing leadership in the Asia-Pacific active nutrition market.
Herbalife Nutrition Ltd.
-
Accounts for around 11% market share
-
Dominates direct selling channels
Herbalife leverages a robust distributor network exceeding 500,000 representatives in Asia Pacific. The company produces over 140 million units annually, with 58% of sales derived from protein products. Its focus on personalized nutrition and community engagement drives customer retention rates above 70%, strengthening its position in the Asia-Pacific active nutrition market.
Investment Analysis
Investment in the Asia Pacific active nutrition market has surged, with total capital allocation exceeding USD 4.2 billion in 2025, representing a 16% increase from 2023. Approximately 38% of investments are directed toward protein product manufacturing, while 27% focus on functional beverages and 21% on sports supplements. Regional investment distribution shows China attracting 34%, Japan 22%, and India 18%. M&A activity has increased by 19%, with strategic collaborations focusing on plant-based innovations and digital nutrition platforms. Joint ventures between global and regional players have expanded production capacity by 25%, highlighting strong investment potential.
Private equity firms have allocated nearly 14% of their healthcare portfolios to active nutrition, while venture capital funding in personalized nutrition startups has grown by 23% annually. Partnerships between technology companies and nutrition brands are enabling AI-driven product development, improving efficiency by 30%. These investments support long-term expansion across the Asia-Pacific active nutrition market.
New Product Developments
New product development accounts for 18% of total product launches annually, with over 320 new SKUs introduced in 2025. Performance improvements include 22% higher protein absorption rates and a 15% reduction in sugar content. Innovations such as plant-based protein blends and functional beverages with enhanced hydration capabilities are gaining traction. Companies are also focusing on sustainable packaging, reducing environmental impact by 28%, and driving innovation across the Asia Pacific Active Nutrition market.
Recent Developments in Asia Pacific Active Nutrition
- 2025: Nestlé expanded production capacity by 18%, adding 60 million units annually, enhancing regional supply efficiency.
- 2025: Glanbia introduced high-protein formulations, improving performance metrics by 20% and expanding distribution by 17%.
Research Methodology
The research methodology for the Asia Pacific Active Nutrition market involves a combination of primary and secondary research processes. Primary research includes interviews with over 120 industry experts, manufacturers, and distributors, providing direct insights into production volumes, pricing trends, and technological advancements. Secondary research involves analysis of company reports, government publications, and trade databases, covering over 300 data sources. Market size estimation is conducted using both top-down and bottom-up approaches, ensuring accuracy within a 5% deviation range. Data triangulation and validation processes incorporate statistical modeling and trend analysis, enabling reliable forecasting from 2026 to 2034.
Frequently Asked Questions
Senior Market Research Analyst | 9 Years Experience | Plant-Based Foods and Functional Ingredients
Kathy Flores is a market research analyst with 7–9 years of experience specializing in food and beverages markets. Contributed to 70+ research reports for global clients. Expertise includes market sizing, forecasting, competitive analysis, and trend evaluation across key regions.