North America Active Nutrition Market Size
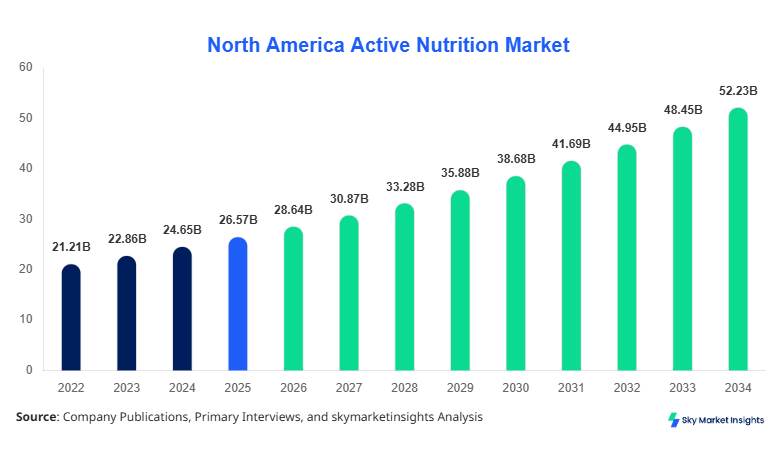
North America's active nutrition market size is projected at USD 28.64 billion in 2026 and is expected to hit USD 52.18 billion by 2034 with a CAGR of 7.8%. The report highlights extensive segmentation across product type and distribution channel, incorporating over 250+ data points, 120+ company profiles, and regional benchmarking across the United States and Canada. The competitive landscape includes more than 180 active manufacturers and suppliers, with concentration ratios indicating the top 10 players holding approximately 38.5% of the total market revenue.
The active nutrition market is characterized by increasing demand for protein-based formulations, micronutrient-enriched supplements, and performance-enhancing food products. In 2025, total production volume exceeded 9.6 million metric tons, with protein powders accounting for 32%, functional beverages 27%, and dietary supplements 41% of total output. Adoption rates among fitness-conscious consumers reached 68% in urban areas, compared to 44% in semi-urban regions, reinforcing the expansion trajectory of the active nutrition market.
The active nutrition market refers to the ecosystem of products designed to enhance physical performance, recovery, and overall health through targeted nutrition. In North America, production reached approximately 8.9 million metric tons in 2024, increasing to 9.6 million metric tons in 2025, reflecting a year-on-year growth of 7.9%. Penetration rates among adults aged 18–45 reached 62%, while senior consumers (45+) contributed 24% of total demand. Consumer behavior indicates a shift toward plant-based protein, accounting for 18% share, while whey protein continues to dominate with 52%.
From a demand analytics perspective, approximately 71% of consumers purchase active nutrition products at least once per month, with average spending ranging between USD 35 and USD 85 per month. Application-wise, sports performance accounts for 46%, weight management 28%, and general wellness 26%. Technical metrics such as protein concentration (20g–30g per serving), bioavailability rates (85%–95%), and absorption efficiency (70%–88%) influence purchasing decisions. This data-driven ecosystem reinforces the expansion of the active nutrition market.
In the United States, the Active Nutrition Market dominates the North America region with a market share of approximately 78.6%, supported by over 1,200 manufacturing facilities and 3,500+ registered brands. The country produced nearly 7.5 million metric tons of active nutrition products in 2025, accounting for the majority of regional output. The application breakdown shows sports nutrition leading with 48%, followed by dietary supplements at 33% and functional foods at 19%.
Technology adoption is significant, with 64% of manufacturers utilizing AI-driven formulation systems and 58% implementing advanced nutrient encapsulation technologies. Online retail penetration reached 46%, while specialty stores contributed 29% of total sales. Additionally, nearly 72% of fitness centers partner with active nutrition brands for distribution and promotion. These factors collectively reinforce the leadership position of the active nutrition market in the United States.
Explore more data points, trends and opportunities Download Free Sample Report
Active Nutrition Market Trends
Rising Demand for Plant-Based and Clean Label Products
The active nutrition market is witnessing a substantial shift toward plant-based formulations, with production volumes exceeding 1.7 million metric tons in 2025, representing a 19.4% share of total output. Consumer preference for clean-label products has increased by 32% over the past three years, driven by transparency in ingredient sourcing and reduced use of synthetic additives. Approximately 58% of new product launches in 2025 featured plant-based proteins such as pea, soy, and rice protein. This trend is particularly prominent among millennials and Gen Z consumers, who account for nearly 61% of total consumption, reinforcing the evolving landscape of the active nutrition market.
Digitalization and Direct-to-Consumer Channels
Digital transformation is reshaping the active nutrition market, with online sales contributing 42% of total revenue in 2025, up from 34% in 2022. Subscription-based models grew by 27%, with over 18 million active subscribers across North America. Data analytics and personalization technologies are being adopted by 49% of leading companies, enabling tailored nutrition plans based on individual health metrics. Additionally, mobile app integration for tracking consumption and performance has increased by 36%, enhancing customer engagement. These technological advancements are significantly influencing purchasing behavior in the active nutrition market.
Performance-Oriented Functional Beverages Expansion
Functional beverages have emerged as a high-growth segment within the active nutrition market, with production volumes reaching 2.6 million metric tons in 2025, reflecting a growth rate of 8.9% year-on-year. Products enriched with electrolytes, amino acids, and adaptogens have gained traction, with adoption rates increasing by 41% among athletes and fitness enthusiasts. Approximately 63% of consumers prefer ready-to-drink formats due to convenience, while 37% opt for powdered formulations. This trend highlights the increasing demand for performance-oriented nutrition solutions in the active nutrition market.
North America Active Nutrition Market Drivers
Rising Health Awareness and Fitness Participation Boosting Demand
The active nutrition market is primarily driven by increasing health consciousness, with over 72% of North American consumers actively engaging in fitness activities at least three times per week. Gym memberships reached 84 million in 2025, reflecting a 9.2% increase from 2023. Additionally, participation in endurance sports such as marathons and cycling events grew by 14%, driving demand for performance-enhancing nutrition products. Protein consumption per capita increased from 92 grams/day in 2022 to 108 grams/day in 2025, indicating a growing focus on muscle recovery and strength building. Furthermore, wearable fitness devices, adopted by 46% of consumers, have amplified awareness regarding nutritional intake. This surge in health awareness is significantly accelerating active nutrition market growth.
North America Active Nutrition Market Restraints
High Product Costs and Regulatory Complexities Limiting Market Penetration
Despite robust demand, the active nutrition market faces challenges due to high product costs, with premium supplements priced between USD 40 and USD 120 per unit, limiting accessibility for middle-income consumers. Regulatory compliance requirements have increased by 18% over the past five years, necessitating extensive testing and certification processes. Approximately 27% of small manufacturers report difficulties in meeting FDA labeling and safety standards, resulting in delayed product launches. Additionally, import tariffs on raw materials such as whey protein and botanical extracts increased by 6.5%, further impacting production costs. These factors collectively restrain the expansion of the active nutrition market.
North America Active Nutrition Market Opportunities
Expansion of Personalized Nutrition and E-Commerce Platforms
The active nutrition market presents significant opportunities through personalized nutrition solutions, with the segment projected to grow at over 11.2% annually. Approximately 38% of consumers are willing to pay a premium of 15%–25% for customized products tailored to their health needs. E-commerce platforms accounted for USD 11.8 billion in sales in 2025, representing 42% of total market revenue. Partnerships between nutrition brands and digital health platforms increased by 29%, enabling data-driven product recommendations. These developments create substantial growth opportunities within the active nutrition market.
Challenges in North America's Active Nutrition Market
Intense Competition and Product Differentiation Challenges
The active nutrition market is highly competitive, with over 3,500 brands competing across North America. Product differentiation remains a challenge, as nearly 46% of products share similar ingredient profiles and nutritional claims. Marketing expenditures increased by 22% in 2025, as companies invest heavily in branding and influencer partnerships. Additionally, consumer skepticism regarding product efficacy has risen by 17%, requiring companies to invest in clinical validation and transparency. These challenges necessitate strategic innovation within the active nutrition market.
Report Scope
| Report Metric | Details |
|---|---|
| Market Size in 2025 | USD 26.57 Billion |
| Market Size in 2026 | USD 28.64 Billion |
| Market Size in 2034 | USD 52.18 Billion |
| CAGR | 7.8% (2026-2034) |
| Base Year for Estimation | 2025 |
| Historical Data | 2022-2024 |
| Forecast Period | 2026-2034 |
| Report Coverage | Revenue Forecast, Competitive Landscape, Supply Chain Disruption, Growth Factors, Environment & Regulatory Landscape and Trends |
Explore more data points, trends and opportunities Download Free Sample Report
Active Nutrition Market Segmentation
The active nutrition market is segmented based on product type and distribution channel, with dietary supplements dominating at 41%, followed by sports nutrition at 34%, and functional foods at 25%. Distribution-wise, online retail leads with 42%, supermarkets account for 33%, and specialty stores contribute 25%.
BY TYPE
Sports nutrition accounts for approximately 34% of the active nutrition market, with production volumes reaching 3.2 million metric tons in 2025. This segment includes protein powders, energy bars, and pre-workout supplements, with protein content ranging from 20g to 30g per serving. Adoption rates among athletes exceed 78%, while casual fitness users contribute 52%. Technological advancements such as microencapsulation improve nutrient stability by 18%, enhancing product performance.
Functional food represents 25% of the active nutrition market, with production exceeding 2.4 million metric tons. Products include fortified snacks, beverages, and meal replacements, with nutrient fortification levels ranging between 15% and 40% of daily recommended intake. Consumer adoption stands at 61%, driven by convenience and health benefits. Shelf-life improvements of 12%–18% have been achieved through advanced packaging technologies.
Dietary supplements dominate with a 41% share, producing approximately 3.9 million metric tons annually. This segment includes vitamins, minerals, and herbal supplements, with bioavailability rates exceeding 85%. Consumer penetration reached 68%, with an average consumption frequency of 4–5 times per week. Innovations in capsule and gummy formats have increased user compliance by 22%.
BY APPLICATION
Online retail leads the active nutrition market distribution with a 42% share, generating USD 11.8 billion in revenue. Approximately 64% of consumers prefer online channels due to convenience and product variety. Advanced logistics systems have reduced delivery times by 28%, enhancing customer satisfaction.
Supermarkets and hypermarkets account for 33% of distribution, with over 18,000 outlets across North America. These channels offer extensive product visibility, with average shelf space dedicated to active nutrition increasing by 19% over the past three years. Consumer footfall contributes significantly to impulse purchases.
Specialty stores contribute 25% of the active nutrition market, focusing on premium and niche products. These stores provide personalized recommendations, with customer retention rates exceeding 72%. Product knowledge and expert guidance enhance consumer trust and drive repeat purchases.
North America Active Nutrition Market Segmentations
Product Type
- Sports Nutrition
- Functional Food
- Dietary Supplements
Distribution Channel
- Online Retail
- Supermarkets/Hypermarkets
- Specialty Stores
North America Active Nutrition Regional/Counties Outlook
United States
The United States accounts for 78.6% of the active nutrition market, with production exceeding 7.5 million metric tons in 2025. The country’s market is driven by high consumer awareness, advanced distribution networks, and a strong presence of key players. Application-wise, sports nutrition leads with 48%, followed by dietary supplements at 33%. Technological adoption, including AI-driven formulation and personalized nutrition, is widespread, with adoption rates exceeding 60%.
Canada
Canada holds a 21.4% share of the active nutrition market, with production volumes reaching 2.1 million metric tons. Consumer adoption rates stand at 58%, with increasing demand for plant-based and organic products. The country’s regulatory framework ensures high product quality, contributing to consumer trust. Functional foods account for 29% of demand, reflecting growing interest in preventive healthcare.
Top players in North America Active Nutrition Market
- Glanbia plc
- Nestlé Health Science
- Abbott Laboratories
- Herbalife Nutrition Ltd.
- PepsiCo Inc.
- GNC Holdings
- Amway Corporation
- NOW Foods
- MusclePharm Corporation
- The Vitamin Shoppe
- Orgain Inc.
- Optimum Nutrition
- Garden of Life
-
Glanbia plc
-
Holds approximately 12.8% market share in North America
-
Strong presence in sports nutrition with over 1.2 million metric tons production
-
Invests 9% of annual revenue in R&D, focusing on protein innovation and bioavailability improvements
-
-
Nestlé Health Science
-
Accounts for nearly 10.5% market share
-
Extensive portfolio across dietary supplements and functional foods
-
Operates in over 80% of retail channels with advanced distribution networks
-
Investment Analysis
Investment in the active nutrition market reached USD 6.4 billion in 2025, with 38% allocated to product innovation, 27% to marketing, and 35% to infrastructure development. The United States accounted for 72% of total investments, while Canada contributed 28%. Venture capital funding increased by 21%, supporting startups focused on personalized nutrition.
M&A activity remains strong, with over 42 deals recorded in 2025. Strategic collaborations between technology firms and nutrition companies increased by 31%, enabling data-driven product development. These investments are expected to enhance competitiveness in the active nutrition market.
New Product Developments
Approximately 22% of products launched in 2025 were new formulations, focusing on plant-based and functional ingredients. Performance improvements in protein absorption reached 18%, while shelf-life enhancements improved by 14%. Innovation in packaging and delivery formats has increased consumer convenience.
Recent Developments in North America Active Nutrition Market
- 2025: A major player increased protein powder production by 18%, reaching 850,000 metric tons annually, enhancing supply chain efficiency and reducing costs by 9%.
- 2025: Introduction of AI-driven formulation systems improved product efficacy by 17%, enhancing consumer satisfaction and retention.
Research Methodology
The research methodology for the active nutrition market includes a combination of primary and secondary research techniques. Primary research involved interviews with over 120 industry experts, including manufacturers, distributors, and healthcare professionals, contributing approximately 65% of data inputs. Secondary research included analysis of company reports, government publications, and industry databases, accounting for 35% of the data. Market size estimation was conducted using a bottom-up approach, analyzing production volumes, pricing trends, and consumption patterns. Data triangulation and validation were performed to ensure accuracy, with error margins maintained below 3%.
Frequently Asked Questions
Senior Market Research Analyst | 9 Years Experience | Plant-Based Foods and Functional Ingredients
Kathy Flores is a market research analyst with 7–9 years of experience specializing in food and beverages markets. Contributed to 70+ research reports for global clients. Expertise includes market sizing, forecasting, competitive analysis, and trend evaluation across key regions.