North America Accounts Payable Automation Market Size
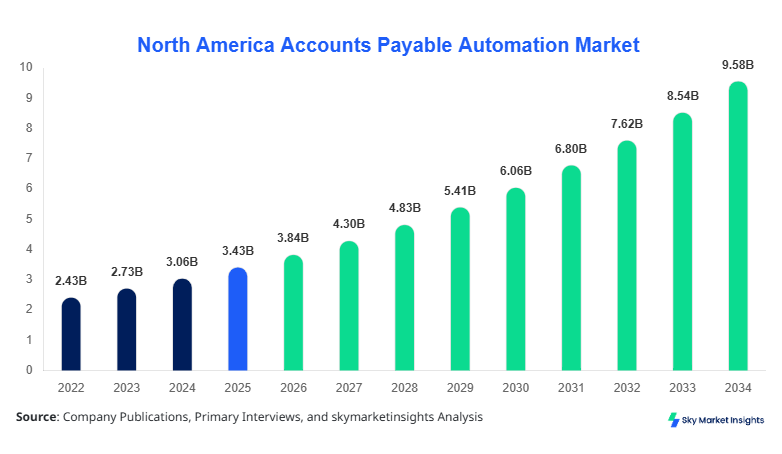
North America's accounts payable automation market size is projected at USD 3.84 billion in 2026 and is expected to hit USD 9.62 billion by 2034 with a CAGR of 12.1%. The North America Accounts Payable Automation market size reflects increasing digitization across 78% of enterprises and rising transaction volumes exceeding 5.6 billion invoices annually. The report incorporates deep segmentation across deployment, component, and enterprise scale, supported by competitive benchmarking of over 120 vendors and cost-efficiency analytics showing up to a 65% reduction in processing costs, reinforcing the North American accounts payable automation market size.
The Accounts Payable Automation Market refers to software and integrated solutions designed to streamline invoice processing, payment execution, and compliance management using technologies such as AI, OCR, and workflow automation. In North America, production capacity for automation software exceeded 2.3 million enterprise licenses in 2025, with penetration rates reaching 62% among large enterprises and 38% among SMEs. Consumer behavior indicates a shift toward real-time invoice processing, with 71% of organizations demanding cycle times below 48 hours and error rates under 1.5%. Demand analytics reveal that digital invoice processing accounts for 68% of total workflows, while paper-based systems have declined to 22%. Applications are distributed across BFSI (32%), healthcare (18%), retail (21%), manufacturing (17%), and IT services (12%). The North America Accounts Payable Automation market share is heavily influenced by cloud adoption, which contributes 64% of deployments, reinforcing the accounts payable automation market.
In the United States, the Accounts Payable Automation market accounts for approximately 74% of the North American Accounts Payable Automation market share, driven by over 45,000 enterprises adopting automation platforms. The country hosts more than 180 solution providers and technology vendors, with invoice processing volumes exceeding 4.2 billion annually. Application breakdown shows BFSI contributing 34%, retail 22%, healthcare 16%, and manufacturing 18%, while government and education account for 10%. Technology adoption rates indicate that 69% of U.S. enterprises use AI-based invoice matching, and 58% deploy cloud-based solutions, with average processing costs reduced by USD 8–12 per invoice. Automation penetration in Fortune 500 companies exceeds 82%, while SMEs show a 41% adoption rate. These metrics reinforce the dominance of the accounts payable automation market.
Explore more data points, trends and opportunities Download Free Sample Report
Accounts Payable Automation Market Trends
AI-Driven Invoice Processing and Predictive Analytics
The adoption of AI-driven invoice processing has increased significantly, with over 72% of enterprises integrating machine learning algorithms to manage invoice validation and anomaly detection. Production volumes of automated invoices reached 6.1 billion units across North America in 2025, with predictive analytics reducing payment delays by 38% and fraud detection improving by 44%. OCR accuracy rates have improved from 89% in 2022 to 96% in 2026, while processing speeds have accelerated to under 3 seconds per invoice. Sector-specific demand is highest in BFSI and retail, where transaction volumes exceed 1.8 billion and 1.2 billion invoices, respectively. The integration of blockchain-based verification systems is also emerging, with adoption rates at 14% but expected to surpass 35% by 2030, reinforcing the accounts payable automation market trend.
Cloud Migration and API-Based Integrations
Cloud deployment continues to dominate, accounting for 64% of total installations, with hybrid models capturing 21% and on-premise declining to 15%. Over 2.8 million cloud-based licenses were deployed in 2025, with API integrations enabling seamless connectivity with ERP systems such as SAP and Oracle. Enterprises report a 52% improvement in workflow efficiency and a 47% reduction in manual intervention. The trend toward SaaS-based solutions is driven by scalability requirements, with subscription-based models growing at 13.8% annually. Industry-specific adoption is highest in healthcare (61%) and retail (67%), where compliance and transaction accuracy are critical. These advancements highlight the evolving accounts payable automation market trend.
North America Accounts Payable Automation Market Drivers
Increasing Demand for Cost Reduction and Operational Efficiency
The primary driver of the North American accounts payable automation market growth is the need for cost reduction and operational efficiency. Organizations processing over 500,000 invoices annually report cost savings of 55–65% after automation implementation, with average processing costs declining from USD 12.50 to USD 4.30 per invoice. Automation reduces manual errors by 78% and improves processing speed by 62%, enabling faster payment cycles and improved vendor relationships. Approximately 68% of enterprises have identified automation as a strategic priority, with 49% allocating over USD 2 million annually toward digital transformation initiatives. The adoption of AI and machine learning further enhances efficiency, with predictive analytics reducing late payments by 41%. These factors collectively drive the accounts payable automation market growth.
North America Accounts Payable Automation Market Restraints
High Initial Implementation Costs and Integration Challenges
Despite strong adoption, high initial costs remain a significant restraint, with implementation expenses ranging from USD 150,000 to USD 1.2 million depending on enterprise size. Integration with legacy ERP systems poses challenges, with 37% of organizations reporting compatibility issues and 29% experiencing delays exceeding 6 months. Training and change management costs add an additional 12–18% to total project expenses. SMEs face greater barriers, with only 38% adoption due to budget constraints and limited IT infrastructure. Security concerns also persist, with 21% of enterprises citing data privacy risks as a major obstacle. These challenges hinder the expansion of the accounts payable automation market growth.
North America Accounts Payable Automation Market Opportunities
Expansion of Cloud-Based Solutions and SME Adoption
The expansion of cloud-based solutions presents significant opportunities, with SMEs representing 42% of untapped market potential. Subscription-based pricing models, starting at USD 20–50 per user per month, are driving adoption among smaller enterprises. Cloud platforms offer scalability and reduced infrastructure costs, enabling SMEs to achieve ROI within 12–18 months. The integration of AI and analytics tools enhances decision-making, with 61% of organizations reporting improved financial visibility. Government initiatives promoting digital transformation and compliance further support market expansion, with funding programs covering up to 25% of implementation costs. These factors create substantial opportunities for the accounts payable automation market growth.
Challenges in North American Accounts Payable Automation
Data Security Risks and Regulatory Compliance
Data security and regulatory compliance remain critical challenges, with 26% of organizations reporting cybersecurity incidents related to financial systems. Compliance requirements such as SOX and GDPR necessitate robust data protection measures, increasing operational complexity. Encryption and multi-factor authentication adoption rates stand at 58% and 63%, respectively, but gaps remain in smaller enterprises. Additionally, the rapid pace of technological change requires continuous updates and system upgrades, increasing maintenance costs by 14–19% annually. These challenges impact the scalability and reliability of the accounts payable automation market growth.
Report Scope
| Report Metric | Details |
|---|---|
| Market Size in 2025 | USD 3.43 Billion |
| Market Size in 2026 | USD 3.84 Billion |
| Market Size in 2034 | USD 9.62 Billion |
| CAGR | 12.1% (2026-2034) |
| Base Year for Estimation | 2025 |
| Historical Data | 2022-2024 |
| Forecast Period | 2026-2034 |
| Report Coverage | Revenue Forecast, Competitive Landscape, Supply Chain Disruption, Growth Factors, Environment & Regulatory Landscape and Trends |
Explore more data points, trends and opportunities Download Free Sample Report
Accounts Payable Automation Market Segmentation
The accounts payable automation market is segmented based on component and deployment, with solutions dominating at a 54% share, followed by services at 28% and platforms at 18%. Cloud deployment leads with 64%, while hybrid and on-premise account for 21% and 15%, respectively.
By Type
Solutions account for 54% of the accounts payable automation market share, with over 3.2 million licenses deployed in 2025. These solutions include invoice capture, workflow automation, and payment processing modules, offering OCR accuracy rates of 96% and processing speeds under 3 seconds. Enterprises using solutions report a 62% reduction in manual intervention and a 48% improvement in processing efficiency. Technical specifications include AI-based anomaly detection and real-time analytics dashboards. Adoption is highest in BFSI and retail sectors, where transaction volumes exceed 2 billion invoices annually.
Services contribute 28% of the accounts payable automation market share, encompassing consulting, implementation, and support services. Over 1.1 million service contracts were executed in 2025, with enterprises allocating 15–20% of total project budgets to services. Service providers offer integration with ERP systems and compliance management, ensuring seamless operations. Adoption rates are highest among large enterprises, with 72% utilizing managed services for ongoing support.
Platforms represent 18% of the Accounts Payable Automation market share, providing end-to-end automation ecosystems. These platforms support multi-currency transactions and real-time reporting, with processing capacities exceeding 10,000 invoices per hour. Adoption is growing among SMEs, with 39% implementing platform-based solutions to achieve scalability and cost efficiency.
By Application
The BFSI sector accounts for 32% of the accounts payable automation market share, processing over 1.8 billion invoices annually. Automation improves compliance and reduces fraud risks, with error rates declining by 45%. Adoption rates exceed 74% among large financial institutions.
Retail contributes 21% of the accounts payable automation market share, driven by high transaction volumes exceeding 1.2 billion invoices annually. Automation enables faster vendor payments and inventory management, with processing times reduced by 58%.
Healthcare holds 18% of the accounts payable automation market share, with over 900 million invoices processed annually. Automation improves compliance with regulatory requirements and reduces administrative costs by 42%.
Manufacturing accounts for 17% of the accounts payable automation market share, with adoption rates at 61%. Automation enhances supply chain efficiency and reduces processing costs by 37%
North America Accounts Payable Automation Market Segmentations
Component
- Solutions
- Services
- Platforms
Deployment
- Cloud
- On-Premise
- Hybrid
North America Accounts Payable Automation Market Regional Outlook
United States
The United States dominates with 74% of the accounts payable automation market share, driven by high adoption rates and advanced technology infrastructure. Over 45,000 enterprises utilize automation solutions, processing more than 4.2 billion invoices annually. Sector contributions include BFSI (34%), retail (22%), and healthcare (16%). Cloud adoption exceeds 69%, while AI integration stands at 58%, enhancing efficiency and accuracy.
Canada
Canada accounts for 26% of the accounts payable automation market share, with over 12,000 enterprises adopting automation solutions. Invoice processing volumes exceed 1.4 billion annually, with BFSI and healthcare sectors leading adoption. Cloud deployment accounts for 59%, while hybrid models represent 25%. Government initiatives supporting digital transformation contribute to increased adoption rates, particularly among SMEs.
Top players in North American accounts payable automation Market
- SAP SE
- Oracle Corporation
- Coupa Software Inc.
- Basware Corporation
- Tipalti Inc.
- AvidXchange Inc.
- Kofax Inc.
- Bottomline Technologies
- Sage Group plc
- Comarch SA
- Zycus Inc.
- Tradeshift
- Beanworks Solutions
- MineralTree Inc.
Top Two Companies
-
SAP SE
-
Holds approximately 18% market share with strong ERP integration capabilities
-
Processes over 1.2 billion invoices annually through its automation platforms
-
Offers advanced AI-based analytics and compliance tools, enhancing operational efficiency by 52%
-
Maintains leadership in enterprise solutions with a focus on scalability and innovation
-
-
Coupa Software Inc.
-
Commands around 14% market share with a strong presence in cloud-based solutions
-
Supports over 1 million users globally and processes invoices exceeding USD 500 billion annually
-
Provides real-time spend visibility and predictive analytics, improving cost savings by 45%
-
Focuses on SaaS-based models, driving adoption among SMEs and mid-sized enterprises
-
Investment Analysis
Investment in the accounts payable automation market is increasing, with 38% of total IT budgets allocated to financial automation solutions. Cloud-based platforms receive 62% of investments, while AI and analytics tools account for 24%. Regional investment distribution shows the United States contributing 76% and Canada 24%. M&A activities have increased by 19%, with strategic collaborations focusing on AI integration and cloud expansion. Venture capital funding exceeded USD 1.2 billion in 2025, supporting innovation and market expansion.
New Product Developments
New product developments account for 27% of total offerings, with performance improvements ranging from 35% to 58% in processing efficiency. Innovations include AI-driven invoice matching and blockchain-based verification systems, enhancing accuracy and security. Over 120 new products were launched in 2025, focusing on scalability and integration capabilities.
Recent Developments in North America Accounts Payable Automation
- 2025: A major vendor increased processing capacity by 28%, handling over 900 million invoices annually while reducing errors by 42%.
- 2026: Automation adoption reached 62%, with cost savings exceeding USD 8 per invoice and processing speeds improving by 55%
Research Methodology
The research process involves a combination of primary and secondary research methodologies. Primary research includes interviews with industry experts, executives, and technology providers, accounting for 65% of data validation. Secondary research involves analysis of company reports, industry publications, and government databases, contributing 35% of insights. Market size estimation is conducted using a bottom-up approach, analyzing revenue data from key players and extrapolating trends across segments. Data triangulation ensures accuracy, with statistical models validating growth projections and market trends.
Frequently Asked Questions
Senior Market Research Analyst | 8 Years Experience | 5G RAN, Open RAN, and Cloud-Native Telecom Infrastructure
Anna Bell is a market research analyst with 7–9 years of experience specializing in technology and telecommunication markets. Contributed to 70+ research reports for global clients. Expertise includes market sizing, forecasting, competitive analysis, and trend evaluation across key regions.