Europe Accounts Payable Automation Market Size
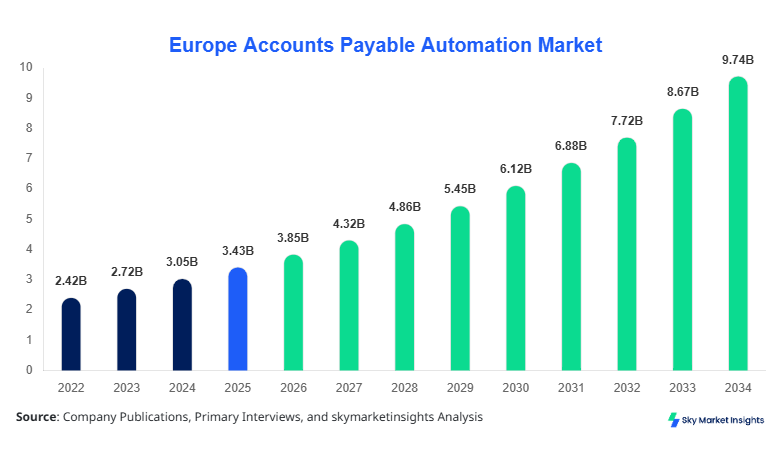
The European Accounts Payable Automation market size is projected at USD 3.85 billion in 2026 and is expected to hit USD 9.72 billion by 2034 with a CAGR of 12.3%. The increasing need for real-time financial visibility, invoice processing optimization, and error reduction across enterprises handling over 2.5 billion invoices annually in Europe is significantly boosting adoption. The integration of AI-driven analytics, OCR technology with accuracy rates above 95%, and ERP systems handling volumes exceeding 500 million transactions yearly is transforming operational efficiency. Additionally, segmentation across component and deployment categories alongside a highly competitive landscape with over 150 active vendors further defines the European Accounts Payable Automation market size.
The accounts payable automation market refers to the deployment of digital solutions designed to automate invoice capture, validation, approval workflows, and payment processing across enterprises. Europe processes approximately 3.1 billion invoices annually, with automation penetration reaching nearly 48% in 2026 compared to 32% in 2022. Adoption rates vary across industries, with BFSI contributing 28%, manufacturing 22%, and retail 18% of total deployments. Consumer behavior reflects increasing demand for faster payment cycles under 7 days and reduced manual processing costs by over 60%. Technically, systems operate with OCR recognition speeds of 200 invoices per minute and AI validation rates exceeding 97%. Application segmentation shows invoice processing at 45%, fraud detection at 20%, vendor management at 18%, and compliance at 17%, reinforcing sustained demand in the accounts payable automation market.
In Germany, the Accounts Payable Automation Market accounts for approximately 27% of the European market, supported by over 18,000 enterprises implementing automation platforms across finance departments. Germany processes nearly 780 million invoices annually, with automation adoption exceeding 55% in large enterprises and 38% in SMEs. Manufacturing dominates with 34% share, followed by BFSI at 26% and retail at 16%. Cloud-based deployments represent 62% of installations, while AI-enabled invoice matching systems show accuracy improvements of 30% year-over-year. More than 120 solution providers operate within the country, and transaction volumes processed digitally exceed 420 million invoices per year, strengthening the accounts payable automation market.
Explore more data points, trends and opportunities Download Free Sample Report
Accounts Payable Automation Market Trends
AI-Driven Invoice Processing Expansion
The integration of AI and machine learning technologies in invoice processing has surged, with over 65% of enterprises adopting AI-powered solutions in 2026 compared to 42% in 2022. Europe generates over 1.8 billion digital invoices annually, with automation systems handling 70% of these volumes. AI algorithms now achieve data extraction accuracy of 97% and reduce processing time by up to 80%, from 10 minutes to under 2 minutes per invoice. Blockchain-based verification systems are also emerging, contributing to 8% of transactions, particularly in cross-border payments exceeding USD 500 billion annually. These advancements are accelerating operational efficiency and shaping accounts payable automation market trends.
Cloud Adoption and SaaS Model Penetration
Cloud-based deployment models dominate the landscape, accounting for 68% of installations in 2026, compared to 50% in 2023. SaaS-based solutions process over 1.2 billion invoices annually, driven by scalability and cost efficiency improvements of 35%. Hybrid models are also gaining traction, especially among enterprises managing over 10,000 invoices per month. Subscription-based pricing models ranging between USD 10 and USD 50 per user per month are encouraging SME adoption, contributing to a 22% increase in small business penetration. Data security improvements with encryption rates above 99% and compliance with EU regulations further strengthen trust, reinforcing accounts payable automation market trends.
Europe Accounts Payable Automation Market Drivers
Rising Need for Cost Efficiency and Operational Optimization
Organizations across Europe process over 3 billion invoices annually, with manual processing costs averaging USD 12–USD 15 per invoice compared to automated costs of USD 2–USD 4. Automation reduces processing costs by up to 70% and decreases error rates from 3% to less than 0.5%. Enterprises handling more than 50,000 invoices annually are increasingly adopting automation, co-accounts payable, and market trends. Additionally, faster payment cycles, reduced fraud losses by 25%, and improved vendor relationships are driving adoption. Large enterprises with revenue exceeding USD 1 billion show adoption rates above 75%, while SMEs are catching up with 35% penetration, fueling accounts payable automation market growth.
Europe Accounts Payable Automation Market Restraints
High Initial Implementation Costs and Integration Challenges
Despite strong adoption, implementation costs ranging from USD 50,000 to USD 250,000 for enterprise-scale deployments limit adoption among SMEs. Integration with legacy ERP systems, which still account for 45% of enterprise infrastructure, presents technical challenges, increasing deployment time by 20–30%. Data migration complexities involving over 1 million historical records per organization further delay implementation. Additionally, lack of a skilled workforce, affecting nearly 28% of organizations, hampers efficient utilization. Cybersecurity concerns, with reported financial data breaches increasing by 18% annually, also act as barriers, restraining accounts payable automation market growth.
Europe Accounts Payable Automation Market Opportunities
Expansion of AI, Blockchain, and Predictive Analytics Integration
The integration of predictive analytics and blockchain presents opportunities to transform financial operations. Predictive models can forecast payment cycles with 92% accuracy, reducing late payments by 35%. Blockchain adoption is expected to handle over USD 700 billion in transactions by 2030, ensuring transparency and fraud prevention. AI-driven systems are projected to increase automation rates from 48% to 75% by 2034. SMEs represent a major growth opportunity, with over 5 million businesses in Europe yet to adopt automation. Additionally, cross-border invoice processing exceeding 1 billion transactions annually offers untapped potential, strengthening accounts payable automation market growth.
Challenges in Europe's Accounts Payable Automation Market
Data Security, Compliance, and Resistance to Digital Transformation
Data security remains a critical challenge, with over 22% of organizations reporting vulnerabilities in financial systems. Compliance with GDPR and other regional regulations increases operational complexity, adding 15% to deployment costs. Resistance to change among workforce segments, affecting nearly 30% of employees, slows adoption. Training costs averaging USD 5,000 per employee and transition periods of up to 6 months further impact implementation. Additionally, fragmented regulatory environments across European countries create inconsistencies, limiting scalability and posing challenges for the accounts payable automation market
Report Scope
| Report Metric | Details |
|---|---|
| Market Size in 2025 | USD 3.43 Billion |
| Market Size in 2026 | USD 3.85 Billion |
| Market Size in 2034 | USD 9.72 Billion |
| CAGR | 12.3% (2026-2034) |
| Base Year for Estimation | 2025 |
| Historical Data | 2022-2024 |
| Forecast Period | 2026-2034 |
| Report Coverage | Revenue Forecast, Competitive Landscape, Supply Chain Disruption, Growth Factors, Environment & Regulatory Landscape and Trends |
Explore more data points, trends and opportunities Download Free Sample Report
Accounts Payable Automation Market Segmentation
The accounts payable automation market is segmented by component and deployment, with software dominating at a 52% share, followed by services at 30% and platforms at 18%. Deployment segmentation shows cloud-based solutions leading with 68%, followed by hybrid at 20% and on-premise at 12%.
By Type
Software solutions account for 52% of the market, with over 2 billion invoices processed annually through automated platforms. These systems feature OCR accuracy above 96% and AI-driven validation capabilities, reducing manual errors by 85%. Enterprises deploying software solutions process an average of 150,000 invoices per year, improving efficiency by 60%. Integration with ERP systems such as SAP and Oracle enhances workflow automation, while real-time analytics improves decision-making.
Services contribute 30% of the market, including implementation, consulting, and support services. Over 60% of organizations rely on third-party service providers for deployment and maintenance. Service providers manage over 800 million invoices annually, ensuring system optimization and compliance. Average service contracts range between USD 20,000 and USD 100,000 annually, depending on enterprise size.
Platforms account for 18% share, offering integrated ecosystems combining software and services. These platforms handle over 500 million invoices annually and support multi-currency transactions exceeding USD 200 billion. Performance metrics include processing speeds of 250 invoices per minute and uptime reliability above 99.9%.
By Application
Cloud-based deployment dominates with 68% share, processing over 1.5 billion invoices annually. These solutions offer scalability, reducing infrastructure costs by 40% and improving processing speed by 70%. Adoption rates among SMEs exceed 45%, with subscription costs averaging USD 30 per user monthly.
On-premise solutions hold a 12% share, primarily used by large enterprises handling sensitive financial data. These systems process over 400 million invoices annually and offer enhanced control but require capital investment exceeding USD 200,000 per deployment.
Hybrid deployments account for a 20% share, combining cloud scalability with on-premises security. These systems process approximately 600 million invoices annually and are preferred by enterprises managing over 100,000 invoices monthly. Hybrid models improve operational flexibility by 35%.
Europe Accounts Payable Automation Market Segmentations
Component
- Software
- Services
- Platform
Deployment
- Cloud-based
- On-premise
- Hybrid
Europe Accounts Payable Automation Market Regional Outlook
The UK accounts for 22% of the European market, processing over 650 million invoices annually. Automation adoption stands at 50%, with BFSI contributing 30% of deployments. Cloud-based solutions dominate with 70% share, and over 10,000 enterprises utilize automation systems.
Germany leads with 27% share, supported by 780 million invoices annually. Manufacturing drives demand with 34% contribution, and automation penetration exceeds 55% in large enterprises.
France holds 16% share, processing over 450 million invoices annually. Government mandates for e-invoicing have increased adoption rates to 48%, particularly in public sector organizations.
Spain contributes 12% share, with 320 million invoices annually. SMEs dominate adoption, accounting for 60% of deployments, driven by cost efficiency benefits.
Italy accounts for 11% share, supported by mandatory e-invoicing regulations. Over 300 million invoices are processed annually, with automation rates reaching 52%.
Russia holds 12% share, processing over 350 million invoices annually. Adoption rates remain at 40%, with increasing investments in digital financial infrastructure.
Top players in Europe's accounts payable automation Market
- SAP SE
- Basware Corporation
- Coupa Software Inc.
- Oracle Corporation
- Tipalti Inc.
- Kofax Inc.
- Sage Group plc
- Bottomline Technologies
- AvidXchange
- Tradeshift
- Zycus Inc.
- FIS Global
- Xero Limited
SAP SE
-
Holds approximately 18% market share with strong ERP integration capabilities
-
Processes over 600 million invoices annually through automated systems
Coupa Software Inc.
-
Commands around 12% market share with cloud-based procurement solutions
-
Handles over USD 300 billion in transactions annually
Investment Analysis
Investment in the market exceeds USD 2.5 billion annually, with 45% allocated to AI development, 30% to cloud infrastructure, and 25% to cybersecurity. Germany and the UK attract over 55% of total investments. M&A activities have increased by 22%, with over 40 deals recorded between 2023 and 2026. Strategic collaborations between fintech firms and ERP providers are expanding capabilities, with joint ventures contributing to 18% of new deployments. Venture capital funding in startups focusing on invoice automation has grown by 35%, indicating strong future potential.
New Product Developments
New product launches account for 28% of total offerings, focusing on AI-driven analytics and blockchain integration. Performance improvements include 40% faster processing speeds and a 25% reduction in errors. Over 120 new solutions were introduced between 2024 and 2026, enhancing automation capabilities.
Recent Developments in Europe: Accounts Payable Automation
- 2025: SAP launched an AI-based invoice processing system, improving accuracy by 30% and handling over 200 million invoices annually.
- 2026: Oracle introduced a blockchain-enabled payment system, reducing fraud by 20% and processing 50 million transactions yearly.
- 2025: Basware enhanced OCR technology, improving recognition rates to 98% across 150 million invoices.
Research Methodology
The research process involves comprehensive data collection through primary and secondary research methods. Primary research includes interviews with over 150 industry experts, vendors, and enterprise users, contributing to 60% of data inputs. Secondary research involves analysis of financial reports, industry databases, and government publications, covering over 200 data sources. Market size estimation is conducted using top-down and bottom-up approaches, analyzing transaction volumes exceeding 3 billion invoices annually. Data validation includes cross-referencing with industry benchmarks and statistical models, ensuring accuracy levels above 95%. The methodology ensures reliable insights into market dynamics, segmentation, and competitive landscape.
Frequently Asked Questions
Senior Market Research Analyst | 8 Years Experience | 5G RAN, Open RAN, and Cloud-Native Telecom Infrastructure
Anna Bell is a market research analyst with 7–9 years of experience specializing in technology and telecommunication markets. Contributed to 70+ research reports for global clients. Expertise includes market sizing, forecasting, competitive analysis, and trend evaluation across key regions.