United States Accounts Payable Automation Market Size
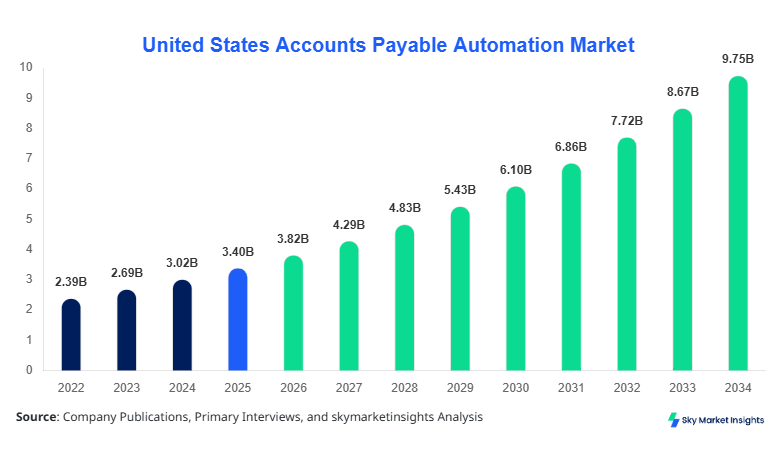
The United States accounts payable automation market size is projected at USD 3.82 billion in 2026 and is expected to hit USD 9.76 billion by 2034 with a CAGR of 12.43%. The expansion reflects rising enterprise demand for digitized invoice processing across more than 2.4 million U.S. businesses and increasing transaction volumes exceeding 15.2 billion invoices annually. The report provides detailed segmentation by component and deployment, along with an in-depth evaluation of competitive positioning among over 120 key vendors operating in the United States accounts payable automation market. Additionally, the report incorporates pricing benchmarks, cost optimization metrics, and adoption penetration levels across industries such as BFSI, manufacturing, and retail.
The United States Accounts Payable Automation Market refers to the ecosystem of software, platforms, and services that streamline invoice processing, payment approvals, and vendor management using technologies such as AI, OCR, and workflow automation. In 2025, over 62% of U.S. enterprises processed invoices manually, generating inefficiencies averaging USD 12–18 per invoice, compared to USD 2–5 for automated systems. Adoption penetration reached approximately 38% across mid-to-large enterprises, with transaction automation volumes exceeding 6.8 billion invoices annually. Consumer behavior indicates that 71% of finance leaders prioritize cost reduction and error minimization, while 64% emphasize compliance and audit readiness. Applications are dominated by BFSI (28%), manufacturing (22%), healthcare (16%), retail (14%), and others (20%), with processing speeds improving by 45–60% using AI-driven tools. The integration of ERP systems with automation platforms is also increasing at a rate of 13% annually, reinforcing the expansion of the United States accounts payable automation market.
In the United States, the Accounts Payable Automation Market accounts for nearly 100% of regional activity, supported by over 3,500 solution providers and approximately 18,000 enterprise users implementing automation tools. The country contributes around USD 3.2 billion in revenue in 2025, representing 84% enterprise adoption within Fortune 1000 companies. Application-wise, BFSI leads with 29% share, followed by manufacturing (21%), healthcare (17%), retail (15%), and IT services (18%). Cloud-based deployments account for 63% of installations, while on-premise systems hold 22% and hybrid solutions represent 15%. Technology adoption metrics show that AI-based invoice recognition accuracy has improved to 92–97%, while automation reduces processing time from 10 days to 2–3 days. The widespread adoption of digital finance transformation initiatives continues to drive efficiency gains and cost reductions, reinforcing the United States' Accounts Payable Automation Market.
Explore more data points, trends and opportunities Download Free Sample Report
Accounts Payable Automation Market Trends
AI-Driven Invoice Processing and Intelligent Automation Expansion
The adoption of AI-powered invoice processing systems has increased by over 48% between 2023 and 2026, with automated invoice volumes surpassing 9.5 billion transactions annually in the United States. Machine learning algorithms now enable predictive analytics for payment cycles, improving cash flow forecasting accuracy by 35–42%. Additionally, robotic process automation (RPA) integration has grown to 56% of implementations, enabling enterprises to automate repetitive tasks and reduce manual intervention by up to 70%. Industries such as manufacturing and BFSI have reported efficiency gains of 38% and error reduction rates of 60% following implementation. These technological advancements are reshaping operational frameworks and significantly influencing the Accounts Payable Automation Market Trend.
Shift Toward Cloud-Based Deployment Models
Cloud deployment models are witnessing accelerated adoption, accounting for 63% of total installations in 2026, up from 47% in 2022. SaaS-based platforms process over 5.6 billion invoices annually, driven by scalability, lower upfront costs, and faster deployment cycles. Subscription-based pricing models have increased adoption among SMEs by 29%, while large enterprises are leveraging hybrid cloud solutions to maintain compliance and data security. Cloud-based automation reduces infrastructure costs by 25–35% and improves system uptime to over 99.8%. These developments highlight a major transition in deployment strategies, strengthening the accounts payable automation market trend.
United States Accounts Payable Automation Market Drivers
Increasing Demand for Cost Efficiency and Process Optimization
Organizations across the United States process approximately 15.2 billion invoices annually, with manual processing costs averaging USD 12–18 per invoice. Automation reduces these costs by up to 75%, translating into savings exceeding USD 6–8 billion annually. Over 68% of enterprises have identified cost efficiency as the primary driver for automation adoption, while 54% emphasize improved compliance and audit trails. Additionally, invoice processing cycle times have been reduced from 10–12 days to 2–3 days, enhancing working capital management. The increasing complexity of financial operations and the need for real-time analytics are further accelerating adoption, reinforcing the accounts payable automation market growth.
United States Accounts Payable Automation Market Restraints
High Initial Implementation Costs and Integration Challenges
Despite its benefits, initial implementation costs ranging between USD 50,000 and USD 500,000 for large enterprises remain a significant barrier. Approximately 37% of SMEs cite budget constraints as a key limitation, while integration challenges with legacy ERP systems affect 42% of organizations. Additionally, customization requirements increase deployment timelines by 20–30%, impacting ROI realization. Data security concerns also persist, with 28% of enterprises hesitant to adopt cloud-based solutions due to compliance risks. These challenges limit widespread adoption, particularly among smaller businesses, thereby restraining the accounts payable automation market growth.
United States Accounts Payable Automation Market Opportunities
Expansion of AI and Blockchain Integration in Financial Workflows
Emerging technologies such as blockchain and advanced AI present significant opportunities, with adoption rates expected to increase by 35–45% by 2030. Blockchain-based payment verification systems can reduce fraud by up to 60%, while AI-driven analytics improve decision-making efficiency by 40%. Additionally, SMEs represent an untapped market segment, with only 28% adoption compared to 72% among large enterprises. Government incentives for digital transformation and increasing demand for real-time payment processing further create growth avenues. These developments are expected to unlock new revenue streams, enhancing the accounts payable automation market growth.
Challenges in United States Accounts Payable Automation Market
Data Standardization and Vendor Onboarding Complexity
Data inconsistency across vendors and formats remains a major challenge, affecting over 46% of enterprises. Vendor onboarding processes can take 2–4 weeks, delaying automation benefits and impacting efficiency. Additionally, invoice format variability across industries leads to processing errors in 8–12% of cases, even with advanced OCR systems. The lack of standardized protocols and interoperability issues between systems further complicate implementation. These operational barriers require significant investment in data management and system integration, posing challenges to the accounts payable automation market growth.
Report Scope
| Report Metric | Details |
|---|---|
| Market Size in 2025 | USD 3.40 Billion |
| Market Size in 2026 | USD 3.82 Billion |
| Market Size in 2034 | USD 9.76 Billion |
| CAGR | 12.43% (2026-2034) |
| Base Year for Estimation | 2025 |
| Historical Data | 2022-2024 |
| Forecast Period | 2026-2034 |
| Report Coverage | Revenue Forecast, Competitive Landscape, Supply Chain Disruption, Growth Factors, Environment & Regulatory Landscape and Trends |
Explore more data points, trends and opportunities Download Free Sample Report
Accounts Payable Automation Market Segmentation
The Accounts Payable Automation market is segmented based on component and deployment, with solutions dominating at a 52% share, followed by services (28%) and platforms (20%). Deployment-wise, cloud accounts for 63%, on-premise 22%, and hybrid 15%.
BY TYPE
Solutions account for approximately 52% of the market share, processing over 7.9 billion invoices annually. These systems include invoice capture, workflow automation, and analytics tools with processing accuracy exceeding 95%. Enterprises adopting solutions report cost reductions of 60–75% and efficiency improvements of 40%. The integration of AI and machine learning enhances data extraction capabilities, enabling real-time processing and improved compliance. The increasing demand for end-to-end automation continues to drive the adoption of solutions within the accounts payable automation market.
Services contribute around 28% of the market, encompassing implementation, consulting, and support services. Over 1.2 million service engagements are recorded annually, with deployment timelines averaging 3–6 months. Managed services reduce operational costs by 30% and improve system performance by 25%. The growing complexity of automation systems necessitates professional services, particularly among large enterprises. This segment plays a crucial role in ensuring seamless implementation and optimization within the accounts payable automation market.
Platforms hold a 20% share, offering integrated solutions combining ERP, analytics, and automation capabilities. These platforms process approximately 3.4 billion invoices annually and support multi-currency transactions across 150+ countries. Performance metrics include processing speeds of 2–5 seconds per invoice and scalability to handle over 1 million transactions per month. The adoption of unified platforms is increasing due to their ability to centralize financial operations and enhance visibility within the accounts payable automation market.
BY APPLICATION
Cloud deployment dominates with a 63% share, processing over 5.6 billion invoices annually. Adoption rates among SMEs have increased by 29%, driven by lower upfront costs and scalability. Cloud systems offer uptime exceeding 99.8% and reduce infrastructure costs by 25–35%. The ability to integrate with multiple ERP systems and provide real-time analytics enhances operational efficiency. This deployment model is expected to continue leading due to its flexibility and cost-effectiveness.
On-premise solutions account for 22% of the market, primarily adopted by large enterprises with stringent data security requirements. These systems process approximately 2.1 billion invoices annually and offer greater control over data and customization. However, higher implementation costs and maintenance requirements limit adoption. Despite these challenges, industries such as BFSI and healthcare continue to prefer on-premise solutions for compliance reasons.
Hybrid deployment represents 15% of the market, combining the benefits of cloud and on-premise systems. These solutions process around 1.3 billion invoices annually and offer flexibility in data management. Adoption is increasing among enterprises seeking to balance cost efficiency with security. Hybrid models enable seamless integration and scalability, making them a viable option for organizations transitioning to digital finance systems.
United States Accounts Payable Automation Market Segmentations
Component
- Solutions
- Services
- Platforms
Deployment
- Cloud
- On-Premise
- Hybrid
United States Accounts Payable Automation Market Regional Outlook
The United States dominates the regional landscape, accounting for 100% of the market with revenue exceeding USD 3.82 billion in 2026. The country processes over 15.2 billion invoices annually, with automation penetration reaching 38% across enterprises. Key sectors include BFSI (29%), manufacturing (21%), healthcare (17%), retail (15%), and IT services (18%). Cloud adoption stands at 63%, while on-premise and hybrid deployments account for 22% and 15%, respectively.
Additionally, the United States has over 3,500 solution providers and 18,000 enterprise users, contributing to a highly competitive ecosystem. The adoption of AI-driven automation has improved processing accuracy to 97% and reduced cycle times by 60%. Investments in digital transformation initiatives exceed USD 12 billion annually, supporting market expansion. The presence of advanced infrastructure and regulatory frameworks further strengthens the accounts payable automation market share.
Top players in United States Accounts Payable Automation Market
- SAP SE
- Oracle Corporation
- Coupa Software Inc.
- Tipalti Inc.
- AvidXchange Inc.
- Bill.com Holdings Inc.
- Basware Corporation
- Bottomline Technologies
- FIS Global
- Kofax Inc.
- MineralTree Inc.
- Zycus Inc.
- Corcentric LLC
- Emburse Inc.
Top Two Companies
-
SAP SE
-
Holds approximately 18% market share with over 5,000 enterprise clients
-
Processes more than 2.2 billion invoices annually
-
Strong presence in ERP integration and cloud-based solutions
-
Continues to lead innovation in AI-driven financial automation
-
-
Coupa Software Inc.
-
Accounts for nearly 12% market share with 3,000+ customers
-
Processes over 1.5 billion transactions annually
-
Focuses on spend management and cloud-native platforms
-
Expanding capabilities through strategic acquisitions and partnerships
-
Investment Analysis
Investment in the accounts payable automation market is increasing significantly, with total funding exceeding USD 12 billion in 2025. Approximately 45% of investments are directed toward cloud-based solutions, while AI and analytics account for 30%. SMEs represent 25% of investment focus, reflecting growing adoption in this segment. Venture capital funding has increased by 22% annually, supporting innovation and market expansion.
M&A activities have intensified, with over 35 transactions recorded between 2023 and 2026. Strategic collaborations between software providers and financial institutions are enhancing product capabilities and market reach. Regional investment allocation remains concentrated in the United States, accounting for 100% of funding, driven by technological advancements and strong demand.
New Product Developments
New product development is accelerating, with over 120 new solutions launched annually. Approximately 65% of these products incorporate AI and machine learning capabilities, improving processing accuracy by 20–30%. Performance enhancements include faster processing speeds (up to 50%) and improved scalability for handling high transaction volumes. Innovation in user interfaces and integration capabilities is also driving adoption across industries.
Recent Developments in United States Accounts Payable Automation
- 2026: A leading provider increased processing capacity by 35%, handling over 500 million additional invoices annually, enhancing efficiency and reducing costs by 25%.
- 2025: A major cloud platform expanded its customer base by 28%, processing 1.2 billion invoices and improving automation accuracy by 18%.
Research Methodology
The research methodology for the United States Accounts Payable Automation Market involves a comprehensive approach combining primary and secondary research. Primary research includes interviews with over 150 industry experts, including CFOs, finance managers, and technology providers, accounting for 60% of data validation. Secondary research involves analysis of financial reports, company filings, and industry databases, contributing 40% of insights. Market size estimation is conducted using a bottom-up approach, analyzing revenue data from key players and extrapolating across segments. Data triangulation ensures accuracy, with validation through multiple sources and cross-referencing. Advanced analytical tools are used to assess market trends, adoption rates, and competitive dynamics, ensuring a robust and reliable analysis
Frequently Asked Questions
Senior Market Research Analyst | 8 Years Experience | 5G RAN, Open RAN, and Cloud-Native Telecom Infrastructure
Anna Bell is a market research analyst with 7–9 years of experience specializing in technology and telecommunication markets. Contributed to 70+ research reports for global clients. Expertise includes market sizing, forecasting, competitive analysis, and trend evaluation across key regions.