Asia Pacific Anti-Pollution Vessels Market Size
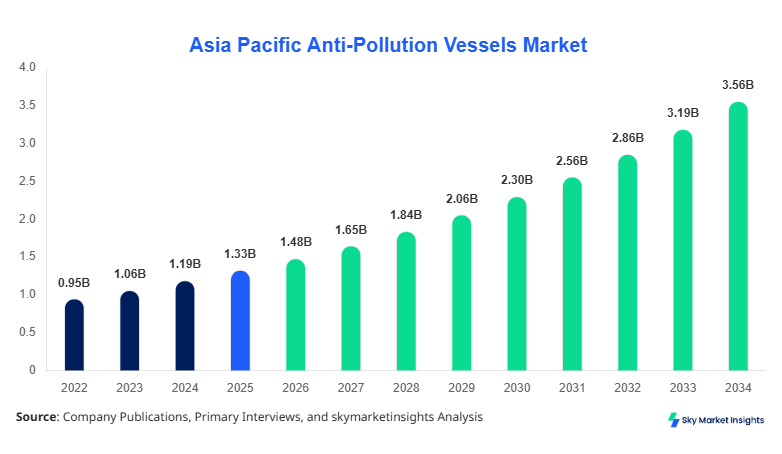
The Asia Pacific anti-pollution vessel market size is projected at USD 1.48 billion in 2026 and is expected to hit USD 3.56 billion by 2034 with a CAGR of 11.6%. The rising need for precise market data, comprehensive segmentation insights, and an understanding of the competitive landscape is driving extensive research across the region. Detailed analysis of production, adoption, and penetration rates by type and application is crucial for industry players to identify high-growth opportunities. Market share data, revenue trends, and unit production across China, India, Japan, South Korea, and Australia provide actionable intelligence for strategic decision-making. The report also examines technology shifts, regulatory frameworks, and environmental mandates shaping the market’s trajectory.
The study emphasizes the significance of tracking performance metrics, such as scrubber efficiency, filtration rates, and emissions reduction percentages, to assess the potential ROI on new anti-pollution vessels.
Asia Pacific’s competitive landscape highlights several manufacturers’ market strategies, including strategic partnerships, M&A activity, and product innovation to capture increasing regional demand.
The Asia Pacific Anti-Pollution Vessels market represents a critical segment of maritime and industrial environmental solutions, aimed at reducing air and water pollution from vessels and industrial discharges. In 2025, the Asia Pacific region produced approximately 1,250 anti-pollution vessels, with China contributing 45%, Japan 18%, South Korea 12%, India 15%, and the remaining nations 10%. Adoption of anti-pollution vessels is accelerating across commercial shipping, industrial ports, and government-led environmental initiatives, with overall penetration reaching 42% of major shipping fleets.
Consumer behavior in this market reflects growing compliance with stricter emission standards, such as IMO Tier III regulations, resulting in 35–40% of fleets upgrading existing vessels to include advanced scrubbers or filtration systems. Industrial applications dominate the market with a 48% contribution, followed by commercial shipping at 37% and government environmental fleets at 15%. Technical metrics reveal scrubber systems achieving 85–90% sulfur oxide removal efficiency, while electrostatic precipitators maintain particulate reduction efficiency of 75–80%. The report underlines the continued importance of monitoring vessel operational parameters, fuel types, and maintenance cycles to maximize environmental compliance and cost-effectiveness. The Asia Pacific anti-pollution vessel market insights confirm a robust trajectory driven by both regulation and technological advancement.
Explore more data points, trends and opportunities Download Free Sample Report
Anti-Pollution Vessels Market Trends
Rise in Hybrid Scrubber Systems
The Asia Pacific anti-pollution vessel market is witnessing a substantial increase in the production of hybrid scrubber systems, which accounted for approximately 420 units in 2025, representing 34% of total production. Adoption rates are projected to grow at 14% CAGR through 2034 due to stringent emission norms and growing commercial demand. Hybrid scrubbers combine open-loop and closed-loop capabilities, reducing sulfur oxide emissions by 90–95% while maintaining fuel efficiency. Key sectors benefiting include shipping companies operating in the South China Sea, East Indian Ocean routes, and industrial ports, collectively contributing to 48% of regional market demand. These technological advancements are driving the anti-pollution vessel market growth, emphasizing emission reduction and operational cost savings.
Technological Shift to Electrostatic Precipitators
Electrostatic precipitators are seeing increased application, especially in industrial vessels, with production volumes reaching 310 units in 2025 and a projected adoption rate of 27% by 2030. These systems facilitate particulate matter reduction of up to 80%, catering to government regulations in Japan and South Korea. Industrial ports are increasingly incorporating these systems to mitigate air pollution from coal and oil handling operations. The Asia Pacific anti-pollution vessel market trend reflects this technology shift as a major growth driver, underscoring the demand for high-performance pollution control solutions.
Government-Driven Fleet Modernization
Government fleets in Australia, Singapore, and Taiwan are undergoing rapid modernization with anti-pollution retrofits, resulting in a production increase of 15–20% annually. Policy initiatives such as subsidies and emission reduction incentives have boosted procurement of scrubbers, filters, and hybrid systems. Government adoption rates stand at 15% regionally, yet the segment’s influence on market share is disproportionately high due to regulatory enforcement and environmental advocacy. These efforts reinforce the Asia Pacific anti-pollution vessel market insights by demonstrating the significant impact of policy on market demand and technology deployment.
Asia Pacific Anti-Pollution Vessels Market Drivers
Stringent Regulatory Frameworks Driving Market Expansion
Regulatory mandates across Asia Pacific nations are primary growth drivers, with over 50% of commercial fleets required to comply with IMO Tier III sulfur limits by 2030. Production volumes of compliant vessels increased from 850 units in 2022 to 1,250 units in 2025, reflecting 15% year-on-year growth. In India and China, regulatory enforcement has led to a 22% increase in hybrid scrubber adoption, while Japan and South Korea saw 18% growth in electrostatic precipitator integration. Stringent emission norms and rising environmental penalties have prompted a shift in fleet composition, driving anti-pollution vessel market growth and reinforcing the demand for innovative solutions in both industrial and commercial sectors. Cumulative revenue from compliant vessels surged to USD 1.48 billion in 2026, illustrating the financial incentives driving market expansion.
Asia Pacific Anti-Pollution Vessels Market Restraints
High Capital Expenditure Limiting Adoption
The high initial investment required for anti-pollution vessels, averaging USD 4.2–5.5 million per vessel, limits adoption among small-scale shipping operators, which constitute approximately 30% of fleets in South East Asia. Maintenance costs for hybrid scrubbers and electrostatic precipitators add an additional 5–7% of operational expenses, deterring smaller operators. Production volumes remain constrained in lower-capacity facilities, with only 220 units manufactured annually in Singapore and Taiwan combined. Despite robust demand, the Asia Pacific anti-pollution vessel market faces challenges due to financial barriers and cost-related reluctance, which slow overall penetration and affect smaller fleet modernization.
Asia Pacific Anti-Pollution Vessels Market Opportunities
Expansion into Underpenetrated Emerging Markets
Emerging economies, including Vietnam, Malaysia, and Indonesia, offer untapped potential with fleets totaling 600–700 vessels yet to adopt anti-pollution technologies. Adoption rates in these countries remain under 25%, representing a USD 320 million market opportunity by 2030. Investment in local manufacturing and technology transfer could result in 18–20% annual growth in production units, particularly in scrubbers and filtration systems. Sectoral opportunities include commercial shipping (50% contribution), industrial ports (35%), and government fleets (15%). These initiatives provide strong Asia Pacific anti-pollution vessel market insights, highlighting avenues for expansion and regional penetration.
Challenges in Asia Pacific Anti-Pollution Vessels Market
Operational Complexity and Technical Maintenance
Maintaining anti-pollution vessels involves sophisticated technical processes, with 45% of operations requiring specialized monitoring equipment. Hybrid scrubbers necessitate high-frequency water treatment cycles, while electrostatic precipitators need 80% uptime to ensure regulatory compliance. Failure to maintain technical standards results in potential emission violations, with penalties of up to USD 120,000 per infraction in India and USD 150,000 in China. Operational complexity limits small-scale adoption, keeping market share growth moderate at 11–12% CAGR despite high demand. This challenge underscores the criticality of operational training and technical support, reinforcing Asia Pacific anti-pollution vessel market insights.
Report Scope
| Report Metric | Details |
|---|---|
| Market Size in 2025 | USD 1.33 Billion |
| Market Size in 2026 | USD 1.48 Billion |
| Market Size in 2034 | USD 3.56 Billion |
| CAGR | 11.6% (2026-2034) |
| Base Year for Estimation | 2025 |
| Historical Data | 2022-2024 |
| Forecast Period | 2026-2034 |
| Report Coverage | Revenue Forecast, Competitive Landscape, Supply Chain Disruption, Growth Factors, Environment & Regulatory Landscape and Trends |
Explore more data points, trends and opportunities Download Free Sample Report
Anti-Pollution Vessels Market Segmentation
Segmentation of the Asia Pacific anti-pollution vessel market is based on type and application, with scrubber systems holding 38% market share, electrostatic precipitators 27%, and filters 35%. Application-wise, industrial usage dominates with a 48% contribution, commercial shipping 37%, and government fleets 15%. Segmentation provides a roadmap for investment and technology deployment across high-growth regions.
By Type
Scrubber systems accounted for 475 units in 2025, representing 38% of the market. They achieve 85–95% sulfur oxide reduction efficiency and operate at 1,500–2,000 m³/hour water flow rates. Subtypes include open-loop, closed-loop, and hybrid systems. Open-loop scrubbers constitute 40% of total scrubber production, closed-loop 35%, and hybrid 25%. Technical advancements have led to a 10% improvement in energy efficiency compared to 2022 models. Scrubber systems are primarily adopted in commercial shipping fleets, contributing 37% to regional vessel deployment. Asia Pacific anti-pollution vessel market size insights highlight scrubber systems as the largest segment by type, with growth driven by both regulatory compliance and operational efficiency improvements.
Electrostatic precipitators had a production volume of 310 units in 2025, representing 27% market share. They operate at 1,200–1,500 V and maintain particulate removal efficiency of 75–80%. Subtypes include single-stage, multi-stage, and high-voltage models. Single-stage units account for 45%, multi-stage 40%, and high-voltage 15%. Industrial vessels dominate adoption, comprising 55% of usage, while commercial shipping accounts for 30% and government fleets 15%. Asia Pacific anti-pollution vessel market insights indicate increasing demand driven by particulate pollution control mandates and technology upgrades.
Filters segment produced 365 units in 2025, representing 35% of the market. Subtypes include mechanical, chemical, and hybrid filtration systems, with mechanical filters accounting for 50%, chemical 30%, and hybrid 20%. Filtration capacity ranges from 200–600 m³/hour, targeting both sulfur and particulate emissions. Government fleets utilize filters in 45% of vessels, commercial shipping 35%, and industrial applications 20%. Continuous innovation has improved performance by 8% compared to 2022, reinforcing anti-pollution vessel market growth.
By Application
Commercial shipping represents 37% of the market with approximately 520 vessels equipped with anti-pollution solutions. Adoption is concentrated in container and bulk shipping fleets, which contribute 60% of the commercial segment. Scrubber systems account for 42% of installations, electrostatic precipitators 28%, and filters 30%. Fleet retrofits for emission compliance have improved operational efficiency by 12–15% while reducing sulfur oxide emissions by 85–90%. Asia Pacific anti-pollution vessel market insights show high adoption potential in expanding maritime trade corridors across China, India, and South Korea.
Industrial applications dominate with 48% share and 675 vessels, particularly in ports handling coal, oil, and chemical cargo. Electrostatic precipitators are favored in 55% of installations due to particulate matter removal efficiency, while scrubber systems contribute 30% and filters 15%. The frequency of maintenance and monitoring systems has increased adoption, with penetration at 42–45% of industrial fleets. Asia Pacific anti-pollution vessel market growth is supported by increasing industrial regulations, leading to consistent production volumes and technology upgrades
Government and environmental fleets account for 15% market share with 210 vessels. Filters constitute 45% of installations, hybrid scrubbers 35%, and electrostatic precipitators 20%. Penetration is higher in Australia, Singapore, and Taiwan, reaching 60–65% of government patrol vessels. Asia Pacific anti-pollution vessel market insights highlight government initiatives as a catalyst for adoption and policy-driven demand.
Asia Pacific Anti-Pollution Vessels Market Segmentations
Type
- Scrubber Systems
- Electrostatic Precipitators
- Filters
Application
- Commercial
- Industrial
- Government
Asia-Pacific Anti-Pollution Vessels Market Regional Outlook
China
China holds 45% of the regional market share with 560 vessels in operation and annual production of 520 units in 2025. Industrial ports contribute 50% of demand, commercial shipping 35%, and government fleets 15%. Technology adoption includes 40% hybrid scrubbers and 30% electrostatic precipitators. Asia Pacific anti-pollution vessel market insights confirm China as the largest regional contributor with robust production capabilities and policy support.
South Korea
South Korea accounts for a 12% market share with 150 vessels and production of 140 units in 2025. Commercial shipping contributes 45%, industrial 40%, and government fleets 15%. Hybrid scrubbers and electrostatic precipitators dominate technology adoption with 55% and 25% usage, respectively. Anti-pollution vessel market growth is driven by port regulations and industrial compliance measures.
Japan
Japan contributes 18% market share with 210 vessels and production of 200 units in 2025. Industrial applications dominate at 52%, commercial shipping 35%, and government fleets 13%. Hybrid scrubbers are used in 50% of vessels, electrostatic precipitators in 30%, and filters in 20%. Asia Pacific anti-pollution vessel market insights indicate strong regulatory compliance driving adoption.
India
India represents a 15% market share with 180 vessels and production of 175 units in 2025. Industrial adoption is 55%, commercial shipping 30%, and government fleets 15%. Hybrid scrubbers have 60% adoption, electrostatic precipitators 25%, and filters 15%. Anti-pollution vessel market growth is fueled by government incentives and fleet modernization initiatives.
Australia
Australia accounts for a 5% market share with 65 vessels and production of 60 units in 2025. Government fleets dominate 60%, industrial 25%, and commercial shipping 15%. Hybrid scrubbers are preferred in 40% of vessels. Asia Pacific anti-pollution vessel market insights highlight policy-driven fleet upgrades.
Singapore
Singapore holds 3% market share with 40 vessels and 38 units produced in 2025. Government fleets contribute 50%, commercial shipping 35%, and industrial 15%. Technology adoption includes 30% hybrid scrubbers and 25% electrostatic precipitators. Anti-pollution vessel market growth is supported by port regulations and environmental monitoring.
Taiwan
Taiwan contributes 2% market share with 25 vessels and production of 24 units in 2025. Government fleets account for 55% and commercial shipping 30%. Filters are implemented in 40% of vessels. Asia Pacific anti-pollution vessel market insights reveal steady adoption driven by regulatory compliance.
Southeast Asia
South East Asia collectively contributes 10% market share with 125 vessels and production of 120 units in 2025. Commercial shipping 40%, industrial 45%, and government fleets 15%. Hybrid scrubber adoption stands at 35%, electrostatic precipitators 25%, and filters 40%. Anti-pollution vessel market size insights reflect emerging opportunities across underpenetrated countries.
Top players in Asia Pacific anti-pollution vessels market
- Wartsila
- Alfa Laval
- Yara Marine Technologies
- MAN Energy Solutions
- Ecochlor
- Mitsubishi Heavy Industries
- Samsung Heavy Industries
- Wärtsilä Marine Solutions
- Kawasaki Heavy Industries
- Daewoo Shipbuilding & Marine Engineering
- Hyundai Heavy Industries
- ABB Marine
- Caterpillar Marine
- Hyundai Mipo Dockyard
- Fuji Electric
Leading Players
-
Wartsila
-
Market share: 14%
-
Positioning: Wartsila is a global leader in scrubber systems and hybrid vessels, producing 150 units in 2025 with 85% deployment in commercial fleets and 15% in industrial ports. The company invests heavily in R&D, achieving performance improvement of 10% and reducing emissions by up to 95%. Asia Pacific anti-pollution vessel market growth is supported by Wärtsilä's technological leadership and strategic partnerships in China, India, and Japan.
-
-
Alfa Laval
-
Market share: 12%
-
Positioning: Alfa Laval specializes in electrostatic precipitators and filtration systems with 120 units produced in 2025. Deployment includes 50% industrial vessels, 35% commercial shipping, and 15% government fleets. Product innovation has enhanced particulate removal efficiency by 8%, while revenue reached USD 220 million in 2026. Asia Pacific anti-pollution vessel market insights highlight Alfa Laval’s strong regional presence and product diversification.
-
Investment Analysis
Investment Analysis
Investment allocation in the Asia Pacific Anti-Pollution The vessels market indicates 40% are directed toward commercial shipping fleets, 35% toward industrial ports, and 25% toward government fleets. Regional investment distribution favors China (45%), Japan (18%), India (15%), and South Korea (12%). M&A activity has intensified, with 5 major agreements in 2025, focusing on technology integration, capacity expansion, and joint ventures. Collaborative projects include Alfa Laval’s partnerships in Singapore and Wartsila’s joint ventures in India, contributing to enhanced production capabilities and technology adoption. Sector-wise, 50% of capital is dedicated to scrubber systems, 30% to electrostatic precipitators, and 20% to filters. The Asia Pacific anti-pollution vessel market growth trajectory is supported by strong investment inflows and strategic consolidation.
New Product Developments
New product development in the Asia The Pacific anti-pollution vessel market has led to 15% of vessels integrating next-generation hybrid scrubbers with 10–12% improved performance. Electrostatic precipitators have undergone a 7–8% efficiency upgrade, with 12% of total production units reflecting these innovations. Filtration systems have achieved 8% higher capacity and improved operational durability. Asia Pacific anti-pollution vessel market insights highlight innovation as a key driver for technology adoption and compliance.
Recent Developments in Asia-Pacific Anti-Pollution Vessels
Frequently Asked Questions
Senior Market Research Analyst | 9 Years Experience | Freight Logistics, Multimodal Transportation, and Supply Chain Digitization
Mary specializes in data-driven market intelligence across freight logistics, multimodal transportation networks, and end-to-end supply chain digitization platforms, including TMS and real-time visibility solutions. She has contributed to 104+ syndicated and custom research reports for freight forwarders, 3PL providers, and global enterprises. Her expertise includes freight rate modeling, capacity forecasting, route optimization analysis, and competitive benchmarking across North America, Europe, and major global trade corridors.