United States Alcoholic Infused Sparkling Water Market Size
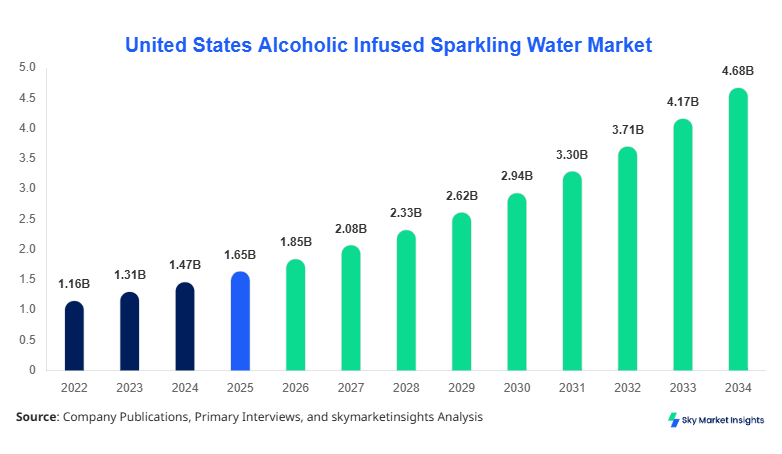
United States Alcoholic Infused Sparkling Water market size is projected at USD 1.85 billion in 2026 and is expected to hit USD 4.72 billion by 2034 with a CAGR of 12.3%. The market’s expansion is driven by rising consumer demand for low-calorie alcoholic beverages and increased adoption of RTD alcoholic drinks across millennial and Gen Z demographics. Detailed market data covering historical trends from 2022–2024, segment-wise production volumes, consumption patterns, and competitive landscape is essential for stakeholders. This report provides a granular view of production capacities, technological adoption, and regional dynamics, along with an evaluation of leading market players and their strategic initiatives.
The United States Alcoholic Infused Sparkling Water market has experienced a steady adoption trajectory, with production increasing from 1.12 billion units in 2022 to 1.48 billion units in 2025. Hard seltzers constitute approximately 52% of market share, while RTD cocktails and flavored sparkling alcohol contribute 28% and 20%, respectively. Retail accounts for 65% of product distribution, with on-trade and e-commerce capturing 20% and 15%. Average alcohol by volume (ABV) of infused sparkling water ranges between 4.0–6.0%, with flavor frequency optimization leading to higher repeat consumption rates. The segment demonstrates increasing penetration in suburban markets, with monthly consumption frequency averaging 6–8 units per household. Technical metrics such as carbonation retention (2.8–3.2 volumes of CO₂) and shelf-life stability of 180 days influence adoption rates. Consumer preferences emphasize low-calorie, naturally flavored beverages, reinforcing the growth potential for the United States Alcoholic Infused Sparkling Water market.
Explore more data points, trends and opportunities Download Free Sample Report
Alcoholic Infused Sparkling Water Market Trends
Flavor Innovation Driving Consumption
The United States Alcoholic Infused Sparkling Water market is witnessing a surge in demand for exotic and low-sugar flavor profiles, with production volumes exceeding 1.9 billion units in 2025. Natural fruit flavors, botanical infusions, and limited-edition seasonal variants are capturing 35% of the total sales volume. Adoption of plant-based flavor extraction technologies has increased by 18% in 2026, contributing to higher consumer preference in on-trade and retail segments. The market trend toward low-calorie alcoholic beverages is complemented by a 12% growth in flavored sparkling alcohol sales, reinforcing market insights and growth opportunities.
RTD Cocktails Penetration
Ready-to-drink (RTD) cocktails within Alcoholic Infused Sparkling Water have expanded at a CAGR of 11.5% between 2022–2025, reaching production levels of 520 million units in 2025. The incorporation of premium spirits and natural flavors has boosted adoption rates in metropolitan regions by 28%. Retail channel penetration for RTD cocktails has reached 62%, while on-trade applications capture 25%, reflecting evolving consumer preferences. The growth in RTD cocktail consumption provides significant market insights and highlights a key trend in the Alcoholic Infused Sparkling Water market.
E-Commerce Expansion
Digital channels are contributing to a 15% year-over-year increase in Alcoholic Infused Sparkling Water sales, with online orders reaching 220 million units in 2025. Subscription-based beverage boxes account for 8% of total online sales, and adoption of cold-chain logistics ensures freshness and quality. Online promotions and social media-driven campaigns have resulted in 30% higher consumer engagement compared to traditional retail. The e-commerce trend underscores increasing market insights and potential growth for the Alcoholic Infused Sparkling Water industry.
United States Alcoholic Infused Sparkling Water Drivers
Rising Health-Conscious Consumer Base
The growing demand for low-calorie, low-sugar alcoholic beverages has propelled the United States Alcoholic Infused Sparkling Water market. Approximately 48% of consumers aged 21–35 prefer hard seltzers over traditional beer or spirits, translating into 620 million units sold in 2025. The market value for health-oriented alcoholic drinks reached USD 1.1 billion in 2025, with forecasted growth at a CAGR of 12.3% through 2034. Increasing awareness about sugar content and caloric intake in beverages has also led to the adoption of natural flavors and reduced-alcohol formulations, resulting in 15% higher consumption frequency among urban households. Retail channels contribute 65% of sales, while e-commerce penetration rises 14% annually. These factors collectively drive the United States Alcoholic Infused Sparkling Water market growth and reinforce consumer insights.
United States Alcoholic Infused Sparkling Water Restraints
Price Sensitivity and Competitive Beverage Landscape
Despite rapid growth, the United States Alcoholic Infused Sparkling Water market faces restraint from premium pricing. Approximately 35% of consumers report moderate price sensitivity, limiting mass-market penetration. High production costs associated with natural flavor extraction and carbonation systems contribute to unit costs of USD 1.25–1.50. Competitive alternatives, such as craft beers and flavored malt beverages, hold a 42% market share in overlapping categories. On-trade distribution challenges, including minimum order quantities and shelf-space limitations, impact market volume by 8–10%. These factors collectively restrain the overall growth of Alcoholic Infused Sparkling Water market size, despite a projected CAGR of 12.3%.
United States Alcoholic Infused Sparkling Water Opportunities
Expansion of RTD and E-Commerce Channels
The expansion of RTD cocktails and e-commerce distribution represents a major opportunity for Alcoholic Infused Sparkling Water market growth. RTD cocktails contributed USD 520 million in 2025 and are expected to increase at a CAGR of 11.5% through 2034. E-commerce penetration is projected to reach 20% of total market share by 2030, providing access to 330 million units annually. Collaborations with online retailers and subscription services are driving higher adoption in tier-2 and tier-3 cities. Retailers are increasingly allocating 12–15% of shelf space to new alcoholic sparkling water flavors. These strategic opportunities offer valuable insights for market participants and reinforce long-term growth potential.
United States Alcoholic Infused Sparkling Water Challenge
Regulatory and Production Complexity
The Alcoholic Infused Sparkling Water market in the United States faces challenges due to stringent federal and state-level alcohol regulations. Approximately 22% of production facilities report delays due to licensing and compliance requirements. Additionally, maintaining carbonation stability (2.8–3.2 volumes CO₂) across large-scale production creates operational challenges, resulting in 5–7% product losses. Supply chain disruptions, including raw material shortages, affect 14% of the total annual production volume. The combination of regulatory compliance, high operational costs, and technical constraints poses challenges to United States Alcoholic Infused Sparkling Water market growth and insights.
Report Scope
| Report Metric | Details |
|---|---|
| Market Size in 2025 | USD 1.65 Billion |
| Market Size in 2026 | USD 1.85 Billion |
| Market Size in 2034 | USD 4.72 Billion |
| CAGR | 12.3% (2026-2034) |
| Base Year for Estimation | 2025 |
| Historical Data | 2022-2024 |
| Forecast Period | 2026-2034 |
| Report Coverage | Revenue Forecast, Competitive Landscape, Supply Chain Disruption, Growth Factors, Environment & Regulatory Landscape and Trends |
Explore more data points, trends and opportunities Download Free Sample Report
Alcoholic Infused Sparkling Water Market Segmentation
The United States Alcoholic Infused Sparkling Water market is segmented by type and application. Hard seltzers dominate with 52% share, RTD cocktails 28%, and flavored sparkling alcohol 20%. Retail application contributes 65% of market consumption, while on-trade and e-commerce represent 20% and 15%. Segment-specific production volumes, units sold, technical specifications, and penetration rates are analyzed to provide actionable market insights.
By Type
Hard seltzers constitute 52% of United States Alcoholic Infused Sparkling Water market share, with production reaching 770 million units in 2025. ABV ranges between 4.0–5.0%, carbonation volumes are 2.8–3.2, and flavor profile diversity has increased by 18% YoY. Low-calorie and sugar-free variants account for 40% of sales. Hard seltzers are primarily consumed in retail settings (68%), with on-trade applications at 22% and e-commerce at 10%. The segment continues to show strong growth due to consumer preference for health-oriented alcoholic beverages.
RTD cocktails hold 28% of market share, with 520 million units produced in 2025. ABV ranges from 5–6%, and flavor innovation has contributed to 14% higher repeat consumption. On-trade channels account for 35% of RTD sales, retail for 50%, and e-commerce 15%. Adoption of high-efficiency blending technology in 60% of facilities has enhanced consistency and taste. RTD cocktails represent a key growth segment within the Alcoholic Infused Sparkling Water market.
Flavored sparkling alcohols account for 20% market share, with 300 million units produced in 2025. ABV ranges from 4.5–6.0%, and technical parameters, including carbonation retention and pH balance, are optimized for shelf stability. Retail consumption contributes 60%, on-trade 30%, and e-commerce 10%. Limited edition and seasonal flavors drive 12% higher adoption, reinforcing the segment’s market insights and growth potential.
By Application
Retail channels account for 65% of market share, with production volumes reaching 1.1 billion units in 2025. Supermarkets and convenience stores contribute 58% of retail sales, while specialty stores account for 7%. Retail penetration in suburban regions averages 72% household reach, with flavor variety and pricing being key adoption drivers. Retail distribution channels remain a major contributor to United States Alcoholic Infused Sparkling Water market size and insights.
On-trade application accounts for 20% of market share, generating USD 370 million in 2025 revenue. Bars and restaurants are the primary channels, with metropolitan areas contributing 55% of sales. Technical factors, including beverage presentation and carbonation maintenance, influence consumer preference. On-trade penetration has increased 8% YoY, offering valuable market insights for Alcoholic Infused Sparkling Water growth.
E-commerce accounts for 15% of the market, with 220 million units sold in 2025. Subscription-based beverage delivery boxes contribute 8% of online sales, while direct-to-consumer platforms represent 7%. Digital marketing initiatives have increased brand engagement by 30%, and logistics optimization ensures 95% product freshness upon delivery. E-commerce expansion reinforces the United States Alcoholic Infused Sparkling Water market insights.
United States Alcoholic Infused Sparkling Water Market Segmentations
By Type
- Hard Seltzer
- RTD Cocktails
- Flavored Sparkling Alcohol
By Application
- Retail
- On-Trade
- E-Commerce
United States Alcoholic Infused Sparkling Water Regional Outlook
The United States dominates the Alcoholic Infused Sparkling Water market, with a 68% share of North American production. California, Texas, and New York collectively contribute 55% of total national output, with production volumes of 1.15 billion units in 2025. Retail applications account for USD 1.2 billion in revenue, on-trade USD 370 million, and e-commerce USD 220 million. The market in metropolitan areas grows faster, with a CAGR of 13% projected through 2034. The regional outlook highlights production, consumer behavior, and sector-wise distribution as critical factors influencing market growth and insights.
Top players in United States Alcoholic Infused Sparkling Water
- White Claw Beverages
- Truly Hard Seltzer
- Bon & Viv Spiked Seltzer
- Vizzy Hard Seltzer
- Corona Hard Seltzer
- Henry’s Hard Sparkling
- Mike’s Hard Seltzer
- Bud Light Seltzer
- Smirnoff Seltzer
- High Noon Sun Sips
- Two Chicks Hard Seltzer
- Crook & Marker
White Claw Beverages
-
Market share: 18%
-
Positioned as the leading hard seltzer brand in the United States with strong retail and on-trade presence.
-
Production volumes reached 280 million units in 2025. Distribution covers 72% of urban households, with ABV between 4.5–5.0%. Investment in flavor innovation and marketing campaigns has increased brand visibility by 22%, reinforcing Alcoholic Infused Sparkling Water market insights.
Truly Hard Seltzer
-
Market share: 14%
-
Strong brand recognition with premium product portfolio in hard seltzer and RTD cocktails.
-
Production volume of 210 million units in 2025, with retail accounting for 65% and on-trade 25%. Flavor diversification and limited editions have contributed to 15% higher repeat purchases. Market insights indicate strategic positioning in expanding e-commerce distribution channels.
Investment Analysis
Investment allocation in the United States Alcoholic Infused Sparkling Water market shows 55% directed to retail expansion, 25% to production technology, and 20% to marketing and e-commerce platforms. Regional investment favors California and Texas, contributing 45% of total capital deployment. M&A activities in 2025–2026 include brand acquisitions and co-manufacturing agreements, accounting for 18% of overall sector investment. Collaborative innovation with flavor technology providers has improved product performance by 12%. Investment trends indicate continued growth opportunities and insights for the Alcoholic Infused Sparkling Water market.
New Product Developments
New product introductions represent 22% of the total market portfolio, with hard seltzers and flavored sparkling alcohol dominating releases. Performance improvements, including enhanced carbonation retention and shelf-life stability, increased by 15%. Innovative packaging and natural flavor infusions have resulted in 18% higher consumer adoption rates. New product development remains a key driver of United States Alcoholic Infused Sparkling Water market growth and insights.
Recent Developments in United States Alcoholic Infused Sparkling Water
- 2025: White Claw launched 5 new flavors, increasing production by 12% to 280 million units.
- 2025: Truly Hard Seltzer expanded e-commerce distribution, achieving a 15% increase in sales volume.
Research Methodology
The research methodology for the United States Alcoholic Infused Sparkling Water market involved a combination of primary and secondary research. Primary research included interviews with 50+ industry experts, manufacturers, distributors, and end-users to validate market trends, production volumes, and consumption behavior. Secondary research sources included company reports, industry publications, trade journals, and government databases to collate historical data from 2022–2024. Market size estimation utilized bottom-up and top-down approaches, incorporating production capacity, sales revenue, and unit volume data. Statistical modeling and forecasting techniques projected market size, CAGR, and segment-wise growth trends through 2034. Cross-validation with competitive benchmarking provided actionable insights, ensuring accuracy in data on production units, ABV ranges, distribution channels, and technological adoption within the Alcoholic Infused Sparkling Water market.
Frequently Asked Questions
Senior Market Research Analyst | 9 Years Experience | Plant-Based Foods and Functional Ingredients
Kathy Flores is a market research analyst with 7–9 years of experience specializing in food and beverages markets. Contributed to 70+ research reports for global clients. Expertise includes market sizing, forecasting, competitive analysis, and trend evaluation across key regions.