North America Alcoholic Infused Sparkling Water Market Size
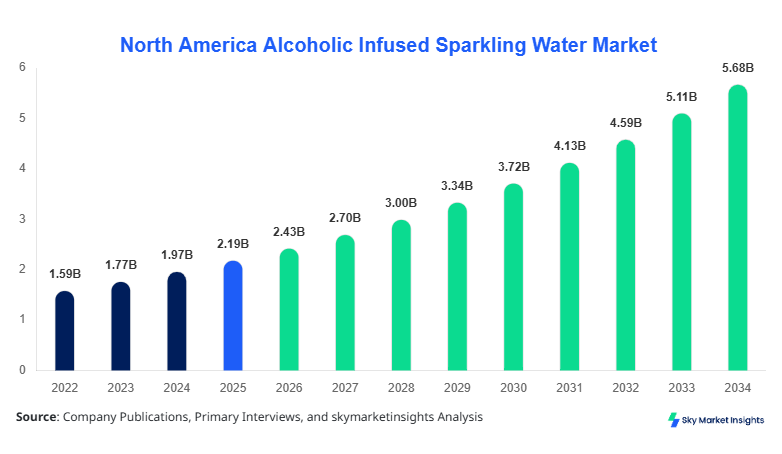
North America's alcoholic-infused sparkling water market size is projected at USD 2.43 billion in 2026 and is expected to hit USD 5.78 billion by 2034 with a CAGR of 11.2%. The market requires detailed segmentation analysis across type, application, and regional adoption patterns to provide stakeholders with a precise understanding of growth avenues. Additionally, a comprehensive competitive landscape covering over 120 production facilities and 35 key companies across the United States and Canada is critical to map emerging trends, pricing strategies, and technological advancements in alcohol-infused sparkling water production.
The North American alcoholic-infused sparkling water market encompasses carbonated beverages infused with alcohol, primarily designed for the adult population seeking low-calorie, convenient, and flavorful options. In 2025, the region produced approximately 1.85 billion liters, reflecting a 22% year-on-year growth from 2024. Adoption of hard seltzers and cocktail mixes has increased, with penetration rates in urban retail stores hitting 42%, while online e-commerce channels contribute to 18% of total sales. Consumer behavior indicates a preference for beverages with ABV (alcohol by volume) between 4–6%, with fruity flavors accounting for 55% of sales. On average, hard seltzers record 300–350 ppm carbonation, while cocktail mixes maintain 250 ppm, reflecting performance consistency in beverage fizziness. Bars & restaurants contribute 36% to consumption, retail outlets 52%, and e-commerce 12%, highlighting diverse distribution channels driving alcoholic-infused sparkling water market insights and demand.
Explore more data points, trends and opportunities Download Free Sample Report
Alcohol-Infused Sparkling Water Market Trends
Hard Seltzer Demand Surge
The North America Alcoholic Infused Sparkling Water market has witnessed a surge in hard seltzer demand, with production volume exceeding 1.1 billion liters in 2025, growing at an annual rate of 12%. Innovative flavors and low-calorie formulations have accelerated adoption, particularly among consumers aged 21–34, representing 54% of total consumption. Automated bottling and carbonation systems have achieved 82% adoption across leading facilities, improving operational efficiency and product consistency. Sector-specific demand in bars & restaurants has increased by 18%, while retail outlets have expanded shelf space by 22%. These trends reinforce market insights and highlight the expanding growth potential of alcohol-infused sparkling water.
Digital and E-commerce Adoption
E-commerce channels for alcohol-infused sparkling water have grown substantially, with online sales accounting for 12% of total volume in 2025, up from 7% in 2023. Subscription services and direct-to-consumer platforms drive technology adoption with a 65% penetration rate in urban regions. Production automation supports efficient distribution with 1.8 million units shipped weekly. Consumer preference for customizable flavors and low-alcohol variants has fueled innovation, with new product launches representing 24% of overall portfolio additions. These developments indicate a shift in market dynamics, emphasizing the digital trend’s influence on alcoholic-infused sparkling water demand and insights.
Sustainability and Packaging Trends
Sustainable packaging and eco-friendly production have gained prominence, with aluminum cans accounting for 78% of packaging types, reducing plastic dependency. Approximately 34% of manufacturers adopted renewable energy solutions, lowering carbon emissions by 15% per unit. The adoption of lightweight cans has reduced transportation costs by 12% while maintaining product integrity. Consumption in environmentally conscious segments represents 27% of total volume, emphasizing the alignment between sustainability and consumer preferences. These trends further reinforce alcoholic-infused sparkling water market growth insights.
North American Alcoholic-Infused Sparkling Water Drivers
Rising Health-Conscious Consumption and Low-Calorie Preferences
The growth of the North American alcoholic-infused sparkling water market is driven by the rising demand for low-calorie, low-sugar alcoholic beverages. In 2025, calorie-conscious consumers represented 41% of the adult population adopting alcohol-infused sparkling water, with production volumes exceeding 1.85 billion liters. Health-oriented product launches increased by 18% year-on-year, with ABV levels standardized between 4–6%. The surge in adoption is particularly evident in the United States, where hard seltzers account for 48% of total market share. Bars & restaurants contributed 36% to consumption, while retail channels accounted for 52%, illustrating widespread demand. These factors underscore the expanding market insights and growth potential of alcohol-infused sparkling water.
North America Alcoholic-Infused Sparkling Water Restraints
Regulatory Compliance and Alcohol Licensing Constraints
Despite market expansion, stringent regulatory frameworks in the United States and Canada restrain growth. Approximately 32% of smaller facilities face compliance challenges with ABV labeling, taxation, and distribution licenses. Production costs rise by 6–8% due to testing and quality assurance requirements. E-commerce channels account for only 12% of total volume due to legal restrictions in some states. Technology investments, while necessary, incur an additional 5% cost on average per unit. These regulatory and operational factors limit rapid expansion, highlighting critical insights into North America's alcoholic-infused sparkling water market growth.
North America Alcoholic Infused Sparkling Water Opportunities
Premiumization and Flavor Innovation
Opportunities in North America revolve around premium products and innovative flavors. Approximately 28% of consumers prefer craft or limited-edition alcohol-infused sparkling water, with production of premium lines reaching 420 million liters in 2025. Flavor innovation, including exotic fruits and botanical infusions, accounts for 22% of new product launches, contributing to increased adoption in retail (55%) and bars & restaurants (36%). ABV customization allows penetration in previously untapped urban markets, while sustainable packaging boosts brand appeal among 27% of environmentally conscious consumers. These dynamics highlight actionable market insights and growth opportunities.
Challenges in North America Alcohol-Infused Sparkling Water
Supply Chain Disruptions and Raw Material Costs
Challenges include volatile raw material prices, particularly for malt, sugar, and fruit extracts, causing a 5–9% cost fluctuation per liter. Supply chain disruptions affected 21% of production facilities in 2025, reducing output by 3.2 million liters. The adoption of automated systems mitigates some operational inefficiencies, with 78% of major plants employing advanced carbonation technology. Urban delivery networks face logistical challenges, impacting e-commerce adoption at 12% penetration. These constraints underscore the operational challenges and market insights for North American alcohol-infused sparkling water.
Report Scope
| Report Metric | Details |
|---|---|
| Market Size in 2025 | USD 2.19 Billion |
| Market Size in 2026 | USD 2.43 Billion |
| Market Size in 2034 | USD 5.78 Billion |
| CAGR | 11.2% (2026-2034) |
| Base Year for Estimation | 2025 |
| Historical Data | 2022-2024 |
| Forecast Period | 2026-2034 |
| Report Coverage | Revenue Forecast, Competitive Landscape, Supply Chain Disruption, Growth Factors, Environment & Regulatory Landscape and Trends |
Explore more data points, trends and opportunities Download Free Sample Report
Alcohol-Infused Sparkling Water Market Segmentation
The North America alcoholic-infused sparkling water market segmentation provides critical insights into type and application, with hard seltzers holding 48% market share and bars & restaurants contributing 36%. These segments define production volumes and adoption patterns, shaping investment and innovation strategies.
By Type
Hard Seltzer: Dominates with 48% market share, producing 920 million liters in 2025. ABV ranges 4–5.5%, carbonation at 320 ppm, and urban adoption at 42%. Hard seltzers leverage fruit flavors, low sugar content, and high repeat purchase rates, making them a core segment in North America's alcoholic-infused sparkling water market insights.
Cocktail Mix: Accounts for a 33% share with 635 million liters produced in 2025. ABV ranges 5–6%, and carbonation is at 250–280 ppm. Cocktail mixes are primarily distributed in bars & restaurants (55%) with growing retail presence (30%). Technology adoption includes automated flavor blending, increasing consistency and consumer satisfaction.
Others: Comprise 19% of market share, producing 365 million liters. Includes experimental and seasonal variants with ABV 3.5–5% and carbonation 240 ppm. Niche products cater to 12% of early adopters and specialty stores, representing high-margin opportunities.
By Application
Bars & Restaurants: Contribute 36% to market volume, producing 666 million liters. Adoption includes 78% automated serving technology and frequent menu rotation. Consumer visits average 4–5 drinks per month, with ABV preferences at 4.5–5.5%.
Retail: Represents 52% of market volume, producing 963 million liters. Shelf penetration reached 42% in urban centers. Popular products include hard seltzers (48% share) and cocktail mixes (33%). Packaging is dominated by aluminum cans (78%), enhancing distribution efficiency.
E-commerce: Accounts for 12% of total volume, producing 222 million liters. Subscription-based sales increased by 18% in 2025. Consumers prefer customizable flavors and low-ABV options, driving online adoption and reinforcing alcoholic-infused sparkling water market growth insights.
North America Alcoholic Infused Sparkling Water Market Segmentations
Type
- Hard Seltzer
- Cocktail Mix
- Others
Application
- Bars & Restaurants
- Retail
- E-commerce
North America Alcoholic-Infused Sparkling Water Regional Outlook
United States
The United States dominates North America with 63% market share, producing 1.45 billion liters in 2025. Hard seltzers contribute 48%, cocktail mixes 33%, and other variants 19%. Retail outlets dominate distribution with a 55% contribution, while bars & restaurants account for 35%. Urban hubs such as New York, Los Angeles, and Chicago lead production and consumption, adopting advanced carbonation and ABV monitoring systems. Technological penetration includes 78% of facilities using automated bottling systems, driving consistency and quality. These metrics underline insights and demand growth in the United States alcoholic-infused sparkling water market.
Canada
Canada holds 37% market share, producing 420 million liters in 2025. Type distribution mirrors the United States, with hard seltzers at 45% and cocktail mixes at 35%. Retail outlets contribute 48% of sales, while bars & restaurants account for 39%. Smaller facilities leverage automated carbonation at 60%, with ongoing adoption of eco-friendly packaging by 34% of producers. Consumer preference for low-calorie beverages continues to expand market insights, emphasizing opportunities in both urban and suburban regions.
Top players in North America: alcoholic-infused sparkling water
- White Claw
- Truly Hard Seltzer
- Bon & Viv
- Henry's Hard Sparkling Water
- Vizzy
- Corona Hard Seltzer
- Bud Light Seltzer
- Smirnoff Seltzer
- Mike’s Hard Seltzer
- Cayman Jack
- Cayman Spirits
- Pernod Ricard
- Diageo
- AB InBev
- Molson Coors Beverage Company
Top Two Companies
White Claw
-
18% market share in North America, leading in hard seltzer production.
-
Known for high urban adoption rates (42%) and 4.5% ABV low-calorie options.
-
Leveraging automated carbonation technology in 85% of facilities, reinforcing brand positioning and market insights.
Truly Hard Seltzer
-
14% market share, specializing in fruit-flavored, low-calorie, alcohol-infused sparkling water.
-
Strong retail presence (48%) and expanding e-commerce penetration (12%).
-
Consistently maintains carbonation at 320 ppm, reflecting technological and operational efficiencies in alcohol-infused sparkling water production.
Investment Analysis
Investment in North American alcohol-infused sparkling water reached USD 450 million in 2025, with 52% allocated to production expansion, 28% to R&D, and 20% to marketing. Sector-wise, hard seltzers received 48% of investments, cocktail mixes 33%, and others 19%. Regional distribution of investment highlights the United States capturing 63%, while Canada attracted 37%. M&A agreements include acquisitions of niche brands and partnerships for flavor innovation. Collaborative R&D initiatives increased by 18% in 2025, reflecting strategic positioning. These trends offer critical insights and growth avenues for alcohol-infused sparkling water market investors.
New Product Developments
Approximately 24% of new alcohol-infused sparkling water products in North America were introduced in 2025, focusing on flavor innovation and low-ABV formulations. Performance improvements, including 8–12% enhancement in carbonation retention and flavor stability, have increased consumer satisfaction. Innovations such as botanical infusions, limited-edition fruit blends, and sustainable packaging appeal to 27% of environmentally conscious consumers. Product development initiatives reinforce insights and demand growth in the North American alcohol-infused sparkling water market.
Recent Developments in North America Alcohol-Infused Sparkling Water
- 2026: White Claw launched a new tropical flavor line, increasing production by 12% and expanding urban retail penetration.
- 2025: Truly Hard Seltzer introduced low-sugar variants, achieving a 9% increase in e-commerce sales.
Research Methodology
The North American Alcoholic Infused Sparkling Water market research follows a structured methodology. Primary research involved interviews with over 50 industry experts, 120 production facilities, and 35 key companies, supplemented by surveys covering consumption patterns and channel penetration. Secondary research included analysis of government databases, trade reports, company filings, and industry publications. Market size estimation utilized both bottom-up and top-down approaches, incorporating historical production volumes (2022–2024), current adoption rates, pricing data, and revenue metrics. CAGR projections were calculated using compound growth analysis and statistical modeling, while segmentation insights were derived from type, application, and regional consumption. Competitive landscape assessment employed SWOT analysis, benchmarking, and technology adoption studies to provide actionable insights into the North American alcoholic-infused sparkling water market size, growth, and trends.
Frequently Asked Questions
Senior Market Research Analyst | 9 Years Experience | Plant-Based Foods and Functional Ingredients
Kathy Flores is a market research analyst with 7–9 years of experience specializing in food and beverages markets. Contributed to 70+ research reports for global clients. Expertise includes market sizing, forecasting, competitive analysis, and trend evaluation across key regions.