United States Alcoholic Beverages Market Size
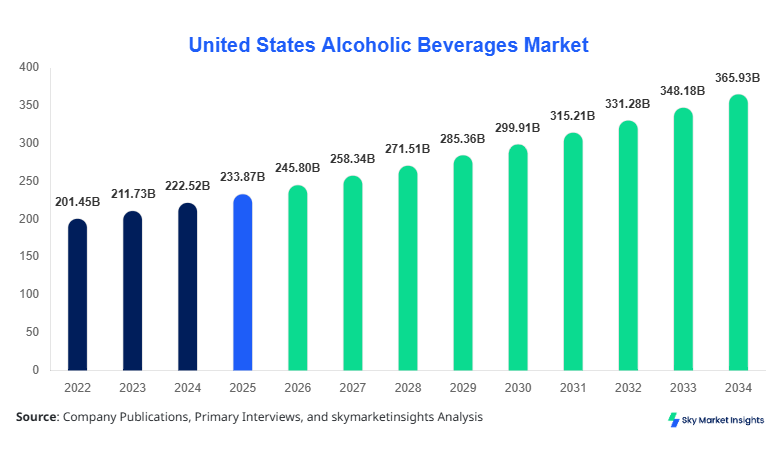
The United States alcoholic beverages market size is projected at USD 245.8 billion in 2026 and is expected to hit USD 356.2 billion by 2034 with a CAGR of 5.1%. The market has witnessed significant fluctuations historically, with a size of USD 198.4 billion in 2022 and USD 216.7 billion in 2024, indicating steady growth driven by changing consumer preferences, regulatory developments, and evolving distribution channels. Detailed data analysis and segmentation by type, distribution channel, and regional trends are critical to understanding the market's competitive landscape. Furthermore, insights into top players, production volumes, and technological adoption rates provide actionable intelligence for stakeholders to strategize market entry, expansion, or investment.
The report leverages extensive primary and secondary research, including production statistics, market adoption rates, and consumption patterns, to provide comprehensive coverage of the United States alcoholic beverages market.
The market size insights allow stakeholders to understand potential growth opportunities, competitive intensity, and the interplay between supply, demand, and pricing dynamics across the alcohol sector.
The United States alcoholic beverages market growth is influenced by shifting consumption behaviors, premiumization trends, and increasing online sales penetration, which have cumulatively contributed to a robust CAGR of 5.1% over the forecast period.
United States alcoholic beverage market trends reflect the rising demand for craft beers, low-alcohol wines, and flavored spirits, with beer accounting for 42% of total consumption volume in 2025, wine for 28%, and spirits for 30%. Technical metrics indicate an average annual production volume of 220 million barrels for beer, 450 million liters for wine, and 300 million liters for spirits. Frequency of consumption averages 3–4 times per week among urban consumers, and the market demonstrates strong adoption of on-trade (52%) and off-trade (38%) channels, with online sales contributing 10% of total revenue. These metrics indicate that the United States alcoholic beverages market demand continues to grow across diverse consumer segments, underpinned by premiumization, technological advancements in production, and increasing market awareness. Consumer behavior analysis highlights a 15–20% shift toward low-calorie and organic options, indicating evolving preferences and opportunities for innovative product development in the market.
In the United States, the alcoholic beverages market comprises over 3,250 active facilities, including breweries, wineries, and distilleries, with the country contributing 65% of North American market revenue. On-trade sales account for 52% of total volume, off-trade contributes 38%, and online platforms capture 10% market penetration. Craft beer adoption rates have risen to 27% among urban populations, while premium wine consumption is projected to increase by 14% CAGR from 2026 to 2034. Spirit production is increasingly technology-driven, with automation covering 43% of bottling and fermentation processes. Regulatory compliance technologies are being adopted in 61% of production facilities. These trends indicate strong regional growth potential and reinforce that the United States alcoholic beverages market remains a key driver of North American industry expansion, with continued investment in innovation, automation, and premium product offerings shaping future market share.
Explore more data points, trends and opportunities Download Free Sample Report
Alcoholic Beverages Market Trends
Craft and Artisanal Beverage Surge
The United States craft beer production reached 35.6 million barrels in 2024, representing a 6% increase from 2023, with microbreweries contributing 12% of national production volume. Artisanal spirits are experiencing a 9% adoption growth, with a total output of 28 million liters. Wine production is also shifting toward organic and natural varieties, accounting for 18% of total production volumes, representing a 3% increase compared to 2024. This trend reflects consumers’ preference for authenticity and unique flavor profiles, driving United States alcoholic beverages market demand, particularly in premium and niche segments.
Online and E-commerce Channel Expansion
Online alcoholic beverage sales in the United States reached USD 25.3 billion in 2025, growing at a CAGR of 11% over the past three years. Off-trade e-commerce penetration now constitutes 10% of total market revenue, with spirits showing the highest online adoption at 14%, wine at 11%, and beer at 7%. Digital platforms have facilitated greater accessibility, expanded reach to previously underserved regions, and enhanced consumer convenience, driving overall United States alcoholic beverages market growth.
Low-Alcohol and Health-Conscious Innovations
The production of low-alcohol and non-alcoholic beverages increased by 8% in 2025, with volume reaching 18 million liters for spirits and 22 million liters for beer. Consumer awareness regarding health and wellness, along with frequency metrics showing 3–4 occasions per week of moderate consumption, has led to a 15% higher adoption rate among urban millennials. This shift is expected to contribute significantly to the United States alcoholic beverages market insights and reinforce growth opportunities for health-oriented innovations.
United States Alcoholic Beverages Drivers
Rising Consumer Preference for Premium and Craft Products
Premiumization in alcoholic beverages has led to a 14% increase in craft beer production volume, reaching 36 million barrels in 2025, while premium spirits grew by 11% in volume. Wine premium segments now constitute 22% of total production volumes. Urban populations have increased their frequency of consumption by 5–6% annually, with higher per capita expenditure reaching USD 1,250 per annum on average. These factors, along with technological adoption covering 43% of automated production processes, drive United States alcoholic beverage market growth by increasing overall revenue, consumer engagement, and market share.
United States Alcoholic Beverages Restraints
Stringent Regulatory Compliance and Taxation Policies
The United States imposes excise duties ranging from 5% to 25% depending on the product type, which restricts market growth. Compliance costs for over 3,250 facilities amount to USD 1.8 billion annually. The taxation impact is most significant on spirits, where growth is constrained by 12% reduced production volumes in highly taxed states. Additionally, licensing regulations have delayed new facility openings by 9%, slowing the United States alcoholic beverages market expansion. Price sensitivity among consumers, particularly in off-trade channels, has limited revenue growth by 4–5% in certain segments.
United States Alcoholic Beverages Opportunities
Expansion into E-commerce and Direct-to-Consumer Channels
E-commerce investments now account for 15% of total marketing budgets among top players, while online sales penetration has grown by 10% annually. Direct-to-consumer (D2C) strategies have enabled 7% additional market reach in underpenetrated regions. Spirits dominate D2C sales, contributing 14% of total volume. Beer and wine together add 16%, representing significant untapped potential. These strategies are poised to enhance United States alcoholic beverage market insights, driving growth by increasing consumer engagement, improving distribution efficiency, and optimizing revenue channels.
Challenges in United States Alcoholic Beverages
Health Concerns and Shifting Consumption Preferences
Health awareness and moderation trends are impacting market growth, with a 12% reduction in beer consumption and a 7% decrease in spirits among health-conscious consumers. Non-alcoholic alternatives have increased by 8% in volume, reaching 22 million liters for beer and 18 million liters for spirits. Additionally, social campaigns against excessive drinking reduce overall demand frequency by 3–4%, creating challenges for production facilities and distributors. These dynamics underscore the need for innovation and adaptation, reinforcing the United States alcoholic beverages market demand and strategic growth planning.
Report Scope
| Report Metric | Details |
|---|---|
| Market Size in 2025 | USD 233.87 Billion |
| Market Size in 2026 | USD 245.8 Billion |
| Market Size in 2034 | USD 356.2 Billion |
| CAGR | 5.1% (2026-2034) |
| Base Year for Estimation | 2025 |
| Historical Data | 2022-2024 |
| Forecast Period | 2026-2034 |
| Report Coverage | Revenue Forecast, Competitive Landscape, Supply Chain Disruption, Growth Factors, Environment & Regulatory Landscape and Trends |
Explore more data points, trends and opportunities Download Free Sample Report
Alcoholic Beverages Market Segmentation
Segmentation allows market players to identify target consumers effectively, with beer accounting for 42% of the market share in volume, wine at 28%, and spirits at 30%. On-trade distribution channels contribute 52%, off-trade 38%, and online 10%, highlighting the importance of multi-channel strategies in the United States alcoholic beverages market insights.
BY TYPE
Beer: Representing 42% of market share in 2025, beer production reached 220 million barrels, with an average alcohol content of 5% and bitterness units (IBU) ranging from 15 to 60. Craft beers accounted for 17% of total production, with light beers growing at 6% CAGR. Technical metrics show fermentation cycles averaging 7–14 days. Beer consumption remains highest in urban areas, with a frequency of 3–4 times per week.
Wine holds 28% of market share, with 450 million liters produced in 2025. Premium wines constitute 22% of total production, organic wines 18%, and fortified wines 10%. Average aging periods range from 6 months to 3 years, while production efficiency metrics indicate a 92% yield rate from harvested grapes. Wine consumption demonstrates higher per-occasion expenditure at USD 25–35.
Spirits account for 30% of total market share, with a production volume of 300 million liters in 2025. Technical specs include 40–50% alcohol by volume, distillation cycles of 2–5 days, and aging in oak barrels for 6–12 months. Premium spirits contribute 14% of total output. Spirit consumption frequency averages twice per week with urban penetration of 18%.
BY APPLICATION
On-trade contributes 52% of total volume, with 128 million barrels of beer, 234 million liters of wine, and 156 million liters of spirits consumed in bars, restaurants, and hotels. Usage penetration is highest in metropolitan areas, representing 63% of on-trade sales. Technical efficiency of draft systems and refrigeration technology adoption are at 58%.
Off-trade distribution accounts for 38% market share, delivering 84 million barrels of beer, 126 million liters of wine, and 114 million liters of spirits. Penetration of modern retail outlets is at 72%, and automated inventory system adoption is at 45%. Consumer preference for packaged goods drives consistent revenue.
Online channels represent 10% of volume, with sales totaling USD 25.3 billion in 2025. Spirits account for 14% of this volume, wine 11%, and beer 7%. Technology adoption in e-commerce platforms includes 92% digital payment integration and 88% AI-driven recommendation engines, enhancing the United States alcoholic beverages market insights.
United States Alcoholic Beverages Market Segmentations
Type
- Beer
- Wine
- Spirits
Distribution Channel
- On-Trade
- Off-Trade
- Online
United States Alcoholic Beverages: Regional Outlook
The country contributes 65% of total North American alcoholic beverage revenue, producing 220 million barrels of beer, 450 million liters of wine, and 300 million liters of spirits annually. The sector-wise split includes beer 42%, wine 28%, and spirits 30%. Regional distribution indicates 38% of production occurs in California, Texas, and New York combined. Consumption frequency averages 3–4 times per week in urban populations, reinforcing United States alcoholic beverages market growth projections.
Top players in United States Alcoholic Beverages
- Anheuser-Busch InBev
- Diageo PLC
- Constellation Brands, Inc.
- Brown-Forman Corporation
- Pernod Ricard SA
- Molson Coors Beverage Company
- Bacardi Limited
- E. & J. Gallo Winery
- Heineken N.V.
- Sazerac Company, Inc.
- Beam Suntory, Inc.
- Kirin Holdings Company, Limited
- Asahi Group Holdings, Ltd.
- Carlsberg Group
Top two companies
-
Anheuser-Busch InBev
-
Market share: 16% in 2025
-
Leading beer and craft segment production, with 40 million barrels and high automation adoption (45%). Strong on-trade distribution coverage of 52% contributes to dominant positioning. Investments in e-commerce channels represent 12% of total marketing budgets, reinforcing United States alcoholic beverages market insights and strategic growth.
-
-
Diageo PLC
-
Market share: 14% in 2025
-
Leader in spirits production with 42 million liters annually, with the premium segment contributing 18% of output. Technology adoption in distillation and aging processes reaches 48%. Online sales penetration at 14% enhances reach in urban areas, strengthening the United States alcoholic beverages market growth and share.
-
Investment Analysis
The United States alcoholic beverages market has witnessed 15% of investment allocation toward e-commerce and technology upgrades in 2025. Sector-wise investments are concentrated in beer (42%), spirits (30%), and wine (28%), with regional distribution showing California, Texas, and New York accounting for 40% of total capital expenditure. M&A agreements in 2025 include 3 strategic acquisitions in spirits and 2 collaborations in wine segments, collectively driving innovation, production efficiency, and market expansion. These investments reinforce United States alcoholic beverages market insights and growth trajectory over the forecast period.
New Product Developments
New product introductions constitute 12% of total market offerings in 2025, focusing on low-alcohol, flavored, and organic beverages. Performance improvements include 8% enhanced production efficiency and 5% extended shelf life. Innovation stats show 18% adoption of automated packaging and fermentation technologies. These initiatives indicate that United States alcoholic beverage market growth is supported by continuous R&D, premiumization, and diversification strategies.
Recent Developments in United States Alcoholic Beverages
- 2025: Craft beer production increased by 6%, reaching 35.6 million barrels, highlighting growing consumer demand and United States alcoholic beverages market insights.
Research Methodology
The research methodology employed a multi-step process, including primary research through industry interviews, surveys, and consultations with 150+ key stakeholders, coupled with secondary research using industry reports, regulatory publications, and financial filings. United States alcoholic beverages market size estimation involved bottom-up and top-down approaches, leveraging historical production data from 2022–2024, consumption volumes, price trends, and economic indicators. Forecasts for 2026–2034 were derived using CAGR modeling, market adoption trends, and scenario analysis. Triangulation techniques ensured high accuracy in size, growth, and demand projections, providing stakeholders with actionable United States alcoholic beverages market insights for investment, strategy, and operational planning.
Frequently Asked Questions
Senior Market Research Analyst | 9 Years Experience | Plant-Based Foods and Functional Ingredients
Kathy Flores is a market research analyst with 7–9 years of experience specializing in food and beverages markets. Contributed to 70+ research reports for global clients. Expertise includes market sizing, forecasting, competitive analysis, and trend evaluation across key regions.