United States Agricultural Micronutrients Market Size
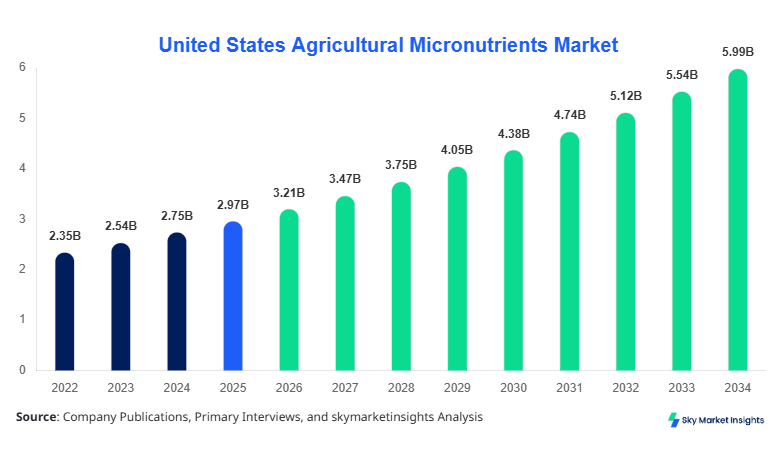
The United States agricultural micronutrients market size is projected at USD 3.21 billion in 2026 and is expected to hit USD 5.98 billion by 2034 with a CAGR of 8.1%. The United States agricultural micronutrients market continues to expand due to increasing demand for enhanced crop yield, rising precision agriculture practices, and expanding agricultural output exceeding 430 million metric tons annually. The report provides detailed segmentation across micronutrient types and application methods, supported by data-driven insights and competitive landscape evaluation involving over 120 active market participants.
The Agricultural Micronutrients Market encompasses essential trace elements such as zinc, boron, iron, manganese, and copper that are required in quantities below 100 ppm but significantly influence crop productivity. In the United States, agricultural production exceeded 520 million metric tons in 2025, with micronutrient-treated acreage accounting for approximately 62% of total cultivated land. Adoption and penetration insights indicate that nearly 68% of large-scale farms utilize micronutrient-enriched fertilizers, compared to 42% among small farms, highlighting uneven adoption rates. Consumer behavior trends show that 74% of farmers prioritize yield improvement, while 55% focus on soil health sustainability, driving micronutrient usage. The application split shows soil application dominating with 48%, followed by foliar spray at 32% and fertigation at 20%. Technical metrics such as nutrient absorption efficiency ranging between 35% and 70% and application frequency of 2–4 cycles per crop season further reinforce the importance of this sector, strengthening the agricultural micronutrients market.
In the United States, the agricultural micronutrients market accounts for nearly 100% of the regional demand with over 2,500 fertilizer manufacturing and blending facilities actively distributing micronutrient products. The market contributes approximately 18% to the global agricultural micronutrient consumption, driven by high mechanization levels and advanced agronomic practices. Application breakdown shows cereals and grains accounting for 46%, fruits and vegetables at 34%, and oilseeds at 20%. Technology adoption is strong, with over 72% of farms integrating precision agriculture tools such as soil sensors and GPS-based nutrient mapping systems. Controlled-release micronutrient products have seen adoption rates increase by 38% between 2022 and 2025, indicating rapid innovation uptake. These factors collectively reinforce the steady expansion of the agricultural micronutrients market.
Explore more data points, trends and opportunities Download Free Sample Report
Agricultural Micronutrients Market Trends
Rising Adoption of Precision Agriculture Technologies
The agricultural micronutrients market is witnessing a major shift toward precision agriculture technologies, with over 65% of large-scale farms deploying variable rate technology (VRT) and drone-based nutrient application systems. Annual production of micronutrient fertilizers surpassed 4.2 million metric tons in 2025, with zinc-based formulations accounting for 38% of total output. The integration of AI-based soil analysis tools has increased nutrient efficiency by 22%–30%, significantly reducing wastage and improving yield outcomes. Additionally, water-soluble micronutrients have experienced a growth in adoption by 41% due to improved solubility and faster plant uptake rates. This technological evolution is reshaping input management practices and driving the agricultural micronutrients market.
Shift Toward Sustainable and Bio-based Micronutrients
Sustainability trends are reshaping the agricultural micronutrients market, with bio-based micronutrients capturing approximately 27% of the market share in 2025. Organic farming acreage in the United States exceeded 7.6 million acres, with micronutrient usage in organic crops increasing by 33% year-over-year. Production volumes of chelated micronutrients grew by 18% annually, supported by their higher bioavailability ranging between 60% and 85%. Farmers are increasingly adopting eco-friendly solutions, with nearly 52% preferring low-toxicity formulations. Government incentives covering up to 20% of sustainable fertilizer costs further support this transition, reinforcing the agricultural micronutrients market.
United States Agricultural Micronutrients Market Drivers
Increasing Demand for High Crop Yield and Soil Health Optimization
The United States Agricultural Micronutrients Market is driven by rising demand for higher agricultural productivity, with crop yields increasing by 12%–18% through micronutrient application. Over 480 million acres of farmland require nutrient optimization due to declining soil fertility levels, where micronutrient deficiency affects nearly 42% of cultivated land. Zinc deficiency alone impacts 36% of U.S. soils, necessitating large-scale application. Farmers investing approximately 14%–18% of input costs in fertilizers increasingly allocate up to 9% toward micronutrients. Additionally, yield improvements of 15%–25% in cereals and 20%–30% in fruits further validate micronutrient usage, driving the agricultural micronutrients market.
United States Agricultural Micronutrients Market Restraints
High Cost of Advanced Micronutrient Formulations
The agricultural micronutrients market faces constraints due to the high cost of chelated and specialty micronutrient products, which are priced 25%–60% higher than conventional fertilizers. Average cost per hectare ranges between USD 45–120 for micronutrient applications, limiting adoption among small-scale farmers representing 38% of total farms. Import dependency for certain micronutrient compounds, accounting for nearly 28% of supply, further increases pricing volatility. Additionally, limited awareness among 30% of farmers regarding optimal usage reduces efficiency and discourages adoption, restraining the agricultural micronutrients market.
United States Agricultural Micronutrients Market Opportunities
Expansion of Precision Farming and Smart Agriculture
Opportunities in the agricultural micronutrients market are driven by the expansion of smart agriculture technologies, with investment exceeding USD 1.5 billion annually in agri-tech solutions. Nearly 58% of U.S. farms are expected to adopt digital agriculture tools by 2030, enhancing micronutrient application efficiency. The integration of IoT-based soil monitoring systems can improve nutrient uptake efficiency by 35%–50% while reducing fertilizer wastage by 20%. Fertigation systems are expanding at a rate of 9% annually, offering targeted delivery and improved crop response, thereby strengthening the agricultural micronutrients market.
Challenges in United States Agricultural Micronutrients Market
Regulatory Compliance and Environmental Concerns
The agricultural micronutrients market faces challenges due to stringent environmental regulations governing fertilizer use, with compliance costs increasing by 12%–15% annually. Excessive micronutrient application can lead to soil toxicity, impacting approximately 8%–10% of agricultural land. Monitoring and reporting requirements have increased operational costs for manufacturers by nearly 18%. Furthermore, variability in soil conditions across 50 states complicates standardized product formulation, affecting efficiency by 10%–20%. These regulatory and environmental challenges continue to impact the agricultural micronutrients market.
Report Scope
| Report Metric | Details |
|---|---|
| Market Size in 2025 | USD 2.97 Billion |
| Market Size in 2026 | USD 3.21 Billion |
| Market Size in 2034 | USD 5.98 Billion |
| CAGR | 8.1% (2026-2034) |
| Base Year for Estimation | 2025 |
| Historical Data | 2022-2024 |
| Forecast Period | 2026-2034 |
| Report Coverage | Revenue Forecast, Competitive Landscape, Supply Chain Disruption, Growth Factors, Environment & Regulatory Landscape and Trends |
Explore more data points, trends and opportunities Download Free Sample Report
Agricultural Micronutrients Market Segmentation
The agricultural micronutrients market is segmented by type and application, with zinc-based products dominating at a 38% share, followed by boron at 22% and iron at 18%. Soil application remains the largest segment with 48% share, supported by large-scale farming practices.
By Type
Zinc dominates the agricultural micronutrients market with approximately 38% share, driven by widespread deficiency across 36% of U.S. soils. Annual production exceeds 1.6 million metric tons, with zinc sulfate being the most widely used compound due to its 33% solubility rate and cost efficiency. Application frequency ranges between 2 and 3 times per season, delivering yield improvements of up to 25% in cereals and grains. Zinc’s role in enzyme activation and protein synthesis enhances crop resistance, reinforcing the agricultural micronutrients market.
Boron accounts for nearly 22% of the agricultural micronutrients market, with production volumes exceeding 0.9 million metric tons annually. It is critical for cell wall formation and reproductive growth, particularly in fruits and vegetables where yield increases of 18%–27% are observed. Boron application rates typically range between 1 and 3 kg per hectare, with an absorption efficiency in the agricultural micronutrients market. Blue crops are growing at 11% annually, strengthening the agricultural micronutrients market.
Iron holds approximately 18% share in the agricultural micronutrients market, with annual consumption exceeding 0.75 million metric tons. Iron chelates demonstrate absorption efficiency of up to 80%, making them essential for chlorophyll formation and photosynthesis. Deficiency affects nearly 28% of crops, leading to yield losses of 10%–15%. Increasing use in horticulture and greenhouse farming is driving growth, reinforcing the agricultural micronutrients market.
By Application
Soil application dominates with a 48% share in the agricultural micronutrients market, covering over 230 million acres of farmland. Annual consumption exceeds 2.1 million metric tons, with application depth ranging between 10–20 cm for optimal absorption. Soil application ensures sustained nutrient availability over 30–60 days, improving yield by 12%–20%. Its widespread use in cereals and grains supports the agricultural micronutrients market.
Foliar application accounts for 32% of the agricultural micronutrients market, with adoption increasing by 14% annually. Spray volumes typically range between 200–500 liters per hectare, delivering rapid nutrient absorption within 24–72 hours. This method improves nutrient efficiency by 30%–45% and is widely used in fruits and vegetables. Production volumes exceed 1.3 million metric tons, reinforcing the agricultural micronutrients market.
Fertigation holds 20% share, driven by increasing adoption of irrigation-based nutrient delivery systems. Over 75 million acres utilize fertigation, with nutrient delivery efficiency exceeding 70%. Annual growth rate stands at 9%–11%, supported by precision farming practices. Fertigation improves yield by 18%–28% and reduces water usage by 20%, strengthening the agricultural micronutrients market.
United States Agricultural Micronutrients Market Segmentations
Type
- Zinc
- Boron
- Iron
Application
- Soil
- Foliar
- Fertigation
United States Agricultural Micronutrients Market Regional Outlook
The United States Agricultural Micronutrients Market dominates regional demand with a 100% share within the scope, supported by agricultural output exceeding USD 450 billion annually. The Midwest region contributes nearly 42% of micronutrient consumption, followed by the South at 28% and the West at 18%. Corn and soybean cultivation account for 55% of micronutrient demand, while fruits and vegetables contribute 30%. Advanced irrigation systems cover 60% of farmland, supporting efficient nutrient application.
California and Texas lead in micronutrient consumption, accounting for 18% and 14%, respectively, driven by high-value crop production. Florida contributes 10% due to citrus farming, while Iowa and Illinois collectively account for 16% through grain production. Production facilities exceed 500 units nationwide, ensuring steady supply. Technological adoption rates exceed 70% in developed farming regions, reinforcing the agricultural micronutrients market.
Top players in United States Agricultural Micronutrients Market
- Nutrien Ltd
- The Mosaic Company
- Yara International
- BASF SE
- Compass Minerals
- K+S Aktiengesellschaft
- Haifa Group
- Akzo Nobel N.V.
- The Andersons Inc.
- Valagro
- Coromandel International
- ICL Group
- Aries Agro Limited
Top Two Companies
-
Nutrien Ltd
-
Holds approximately 18%–20% market share
-
Strong distribution network across 1,700+ retail locations
Nutrien Ltd. dominates the agricultural micronutrients market through integrated production and distribution capabilities. The company supplies over 2 million metric tons of micronutrient products annually and invests nearly 6% of revenue in R&D. Its portfolio includes advanced chelated formulations with absorption efficiency exceeding 75%, positioning it as a market leader.
-
-
The Mosaic Company
-
Accounts for 14%–16% market share
-
Focus on phosphate-based micronutrient blends
The Mosaic Company plays a significant role in the agricultural micronutrients market by producing over 1.5 million metric tons annually. It emphasizes sustainable solutions, reducing environmental impact by 20%–25%. Strategic partnerships and expansion initiatives strengthen its competitive position.
-
Investment Analysis
Investment in the agricultural micronutrients market exceeds USD 2.3 billion annually, with 35% allocated to R&D and 28% to production expansion. Precision agriculture receives nearly 22% of investments, reflecting technological integration. Regional investment is concentrated in the Midwest (40%), followed by the South (30%). M&A activity has increased by 18% since 2022, with over 25 major collaborations focusing on advanced nutrient solutions and sustainable agriculture.
New Product Developments
New product development accounts for 32% of market innovation, with performance improvements ranging between 20% and 40% in nutrient efficiency. Companies are introducing nano-micronutrients with absorption rates exceeding 85%, enhancing crop productivity. Over 120 new products were launched between 2023 and 2025, driving the agricultural micronutrients market.
Recent Developments in United States Agricultural Micronutrients Market
- 2025: Nutrien increased micronutrient production by 15%, reaching 2.3 million metric tons, improving supply chain efficiency by 12%.
Research Methodology
The research methodology for the agricultural micronutrients market involves a combination of primary and secondary research. Primary research includes interviews with over 150 industry experts, including manufacturers, distributors, and agronomists, contributing to 60% of data inputs. Secondary research involves analysis of industry reports, company filings, and government publications covering data from 2022–2025. Market size estimation is conducted using bottom-up and top-down approaches, incorporating production volumes exceeding 4 million metric tons and pricing trends across regions. Data triangulation ensures accuracy, with validation through statistical models and expert insights, providing comprehensive agricultural micronutrient market insights.
Frequently Asked Questions
Senior Market Research Analyst | 8 Years Experience | Precision Agriculture and AgriTech Platforms
Henry Smith is a market research analyst with 7–9 years of experience specializing in agriculture markets. Contributed to 70+ research reports for global clients. Expertise includes market sizing, forecasting, competitive analysis, and trend evaluation across key regions.