North America Agricultural Colorants Market Size
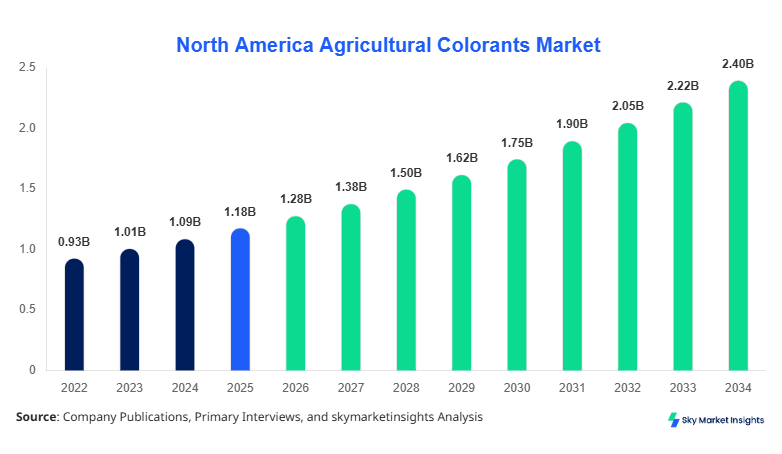
The North America Agricultural Colorants Market market size is projected at USD 1.28 billion in 2026 and is expected to hit USD 2.41 billion by 2034 with a CAGR of 8.2%. The North America Agricultural Colorants Market is witnessing structured expansion driven by increasing precision farming practices, regulatory labeling requirements, and technological integration across over 3,500 agrochemical manufacturing facilities in the region. Detailed segmentation by type and application indicates that natural colorants contribute approximately 46% of total revenue in 2026, while crop protection applications account for nearly 52% of consumption volume. Competitive landscape analysis reveals that the top 10 companies collectively hold over 62% market concentration, with production capacities exceeding 180,000 metric tons annually.
The agricultural colorants market refers to the use of pigments and dyes in agricultural inputs such as pesticides, fertilizers, and seeds to enhance identification, safety compliance, and application efficiency. In North America, production volumes exceeded 145,000 metric tons in 2025, with the United States contributing nearly 78% of output and Canada accounting for 22%. Adoption rates of agricultural colorants have reached approximately 64% across large-scale farming operations, while penetration among small and mid-sized farms remains around 38%. Consumer behavior analysis indicates that 71% of agribusiness buyers prioritize traceability and compliance labeling, driving consistent demand for colorants in crop protection products. Application segmentation highlights that crop protection dominates with 52%, followed by seed treatment at 29% and fertilizers at 19%. Technical performance metrics such as UV stability (above 85%) and solubility efficiency (up to 92%) are critical purchasing criteria. The agricultural colorants market continues to evolve with increased demand for eco-friendly formulations.
In the United States, the agricultural colorants market accounts for nearly 78% of North America’s total revenue, supported by over 2,100 agrochemical production facilities and 1.9 million large-scale farms. Application distribution shows crop protection products leading with 54%, seed treatment at 27%, and fertilizers at 19%. Technological adoption has reached 68% in precision agriculture systems integrating color-coded inputs for efficient deployment. Approximately 82,000 metric tons of agricultural colorants were consumed in 2025, with synthetic variants accounting for 58% of usage due to cost efficiency. The United States market continues to dominate due to advanced supply chain infrastructure and high compliance standards, reinforcing the agricultural colorants market demand.
Explore more data points, trends and opportunities Download Free Sample Report
Agricultural Colorants Market Trends
Rise of Bio-based and Sustainable Colorants
Production of natural agricultural colorants surpassed 66,000 metric tons in 2025, representing a 14% year-over-year increase. Approximately 49% of new product formulations introduced in 2026 utilize plant-derived pigments such as carotenoids and anthocyanins. Adoption rates for bio-based colorants have reached 43% among leading agrochemical companies due to regulatory pressure and environmental sustainability mandates. Technological advancements in extraction processes have improved pigment stability by 18% and shelf life by 22%. Demand from organic farming sectors has increased by 27%, particularly in the United States and Canada, where organic farmland expanded by over 3.5 million acres between 2023 and 2025. These developments are shaping the agricultural colorants market trend.
Integration with Smart Agriculture Systems
The integration of colorants with digital agriculture tools has expanded significantly, with over 35% of large farms using color-coded formulations linked to IoT-based spraying systems. Production of smart-compatible colorants reached 28,000 metric tons in 2025. Adoption of such systems improves application accuracy by 21% and reduces input wastage by 16%. Approximately 62% of agritech companies are investing in sensor-compatible dyes that enhance visibility under varied lighting conditions. The use of fluorescent colorants has increased by 19%, particularly in aerial spraying operations. This technological shift is strengthening the agricultural colorants market trend.
North America Agricultural Colorants Market Drivers
Increasing Demand for Precision Agriculture and Regulatory Compliance
The expansion of precision agriculture across North America has led to a 32% increase in demand for color-coded agrochemicals between 2022 and 2025. Approximately 68% of large-scale farms now utilize precision spraying systems, requiring visible and standardized colorants for differentiation. Regulatory frameworks mandate clear labeling and visual identification in over 85% of pesticide applications, driving consistent demand. Production volumes of colorants used in compliance labeling reached 91,000 metric tons in 2025. Additionally, improved efficiency metrics, such as 18% reduction in misapplication errors, further support adoption. The agricultural colorants market growth is significantly driven by these regulatory and technological factors.
North America Agricultural Colorants Market Restraints
Volatility in Raw Material Prices and Environmental Concerns
Raw material price fluctuations have increased by 22% between 2023 and 2025, particularly affecting synthetic dye production. Petroleum-based intermediates account for nearly 61% of synthetic colorant costs, making the market vulnerable to oil price volatility. Environmental concerns have led to stricter regulations, reducing the use of certain chemical dyes by 17% across North America. Compliance costs have increased by approximately 14%, impacting small manufacturers. Additionally, waste disposal regulations have raised operational costs by 11%. These factors collectively limit expansion potential and create barriers for new entrants, affecting the agricultural colorants market's growth.
North America Agricultural Colorants Market Opportunities
Expansion of Organic Farming and Bio-based Innovations
Organic farming acreage in North America increased by 9.8% annually, reaching over 7.2 million acres in 2025. This has driven demand for natural colorants, which now account for 46% of total market volume. Investment in bio-based innovations has grown by 26%, with over 120 new patents filed between 2022 and 2025. Production capacity for natural pigments is expected to increase by 38% by 2030. Partnerships between agritech firms and biotech companies have increased by 19%, enhancing R&D capabilities. These trends create significant opportunities for expansion, reinforcing the agricultural colorants market demand.
Challenges in North America's Agricultural Colorants Market
Limited Shelf Stability and Performance Constraints
Natural colorants exhibit shelf stability limitations, with degradation rates reaching 12% within 6 months under high UV exposure. Approximately 41% of manufacturers report challenges in maintaining consistent color intensity across batches. Performance constraints such as reduced solubility (down by 15% compared to synthetic variants) impact application efficiency. Storage and transportation costs have increased by 13% due to the need for controlled environments. These technical challenges hinder widespread adoption and require continuous innovation to ensure competitiveness in the agricultural colorants market
Report Scope
| Report Metric | Details |
|---|---|
| Market Size in 2025 | USD 1.18 Billion |
| Market Size in 2026 | USD 1.28 Billion |
| Market Size in 2034 | USD 2.41 Billion |
| CAGR | 8.2% (2026-2034) |
| Base Year for Estimation | 2025 |
| Historical Data | 2022-2024 |
| Forecast Period | 2026-2034 |
| Report Coverage | Revenue Forecast, Competitive Landscape, Supply Chain Disruption, Growth Factors, Environment & Regulatory Landscape and Trends |
Explore more data points, trends and opportunities Download Free Sample Report
Agricultural Colorants Market Segmentation
The Agricultural Colorants Market is segmented based on type and application, with natural colorants dominating a 46% share, followed by synthetic at 42% and mineral-based at 12%. Application-wise, crop protection leads with 52%, seed treatment at 29%, and fertilizers at 19%.
By Type
Natural colorants account for approximately 46% of total market volume, with production exceeding 66,000 metric tons in 2025. These include plant-based pigments such as chlorophyll and carotenoids, offering biodegradability rates above 90%. Adoption is highest in organic farming, where penetration exceeds 58%. Performance improvements in UV stability have reached 85%, making them suitable for outdoor applications. However, production costs are 18% higher than synthetic alternatives.
Synthetic colorants hold around 42% share, with production volumes exceeding 61,000 metric tons. These colorants offer high solubility (above 92%) and consistent performance across varied environmental conditions. Cost efficiency remains a key advantage, with prices approximately 22% lower than natural variants. However, regulatory restrictions have reduced their usage by 17% in certain applications.
Mineral-based colorants represent 12% of the market, with production volumes around 18,000 metric tons. These include iron oxide-based pigments offering high durability and thermal stability above 95°C. Adoption is concentrated in fertilizers and soil applications, where penetration is around 24%.
By Application
Crop protection applications dominate with 52% share, consuming over 75,000 metric tons annually. Colorants enhance visibility during spraying, reducing overlap errors by 21%. Adoption rates exceed 68% among large farms. Technical performance includes high dispersion rates above 88%.
Seed treatment accounts for 29% share, with production usage around 42,000 metric tons. Colorants improve identification and safety compliance, with penetration reaching 61%. Enhanced adhesion properties improve coating efficiency by 17%.
Fertilizers represent 19% share, with usage exceeding 28,000 metric tons. Colorants aid in product differentiation and branding, with adoption rates around 44%. Performance metrics include moisture resistance above 81%.
North America Agricultural Colorants Market Segmentations
Type
- Natural Colorants
- Synthetic Colorants
- Mineral-Based Colorants
Application
- Crop Protection
- Seed Treatment
- Fertilizers
North America Agricultural Colorants Market: Regional Outlook
The United States dominates with 78% share, producing over 113,000 metric tons annually. Crop protection accounts for 54% of usage, followed by seed treatment at 27% and fertilizers at 19%. Advanced technologies and high regulatory compliance drive market leadership.
Canada holds 22% share, with production volumes around 32,000 metric tons. Natural colorants dominate with 52% share due to strong organic farming adoption. Crop protection applications account for 48%, while seed treatment and fertilizers contribute 31% and 21%, respectively.
Top players in North America Agricultural Colorants Market
- BASF SE
- Clariant AG
- Sensient Technologies Corporation
- DIC Corporation
- Chromatech Incorporated
- Aakash Chemicals
- Organic Dyes and Pigments
- Solar Color Dust
- Dynemic Products Ltd
- Neelikon Food Dyes & Chemicals Ltd
- Sun Chemical Corporation
- LANXESS AG
- BASF SE
-
Holds approximately 14% market share with production exceeding 25,000 metric tons annually
-
Strong R&D investment accounting for 18% of total revenue
Clariant AG
-
Commands around 11% share with extensive portfolio in natural pigments
-
Sustainability initiatives contributing to 36% of product pipeline
Investment Analysis
Investment allocation in the market has reached USD 420 million in 2025, with 46% directed toward natural colorant development, 34% toward synthetic optimization, and 20% toward mineral-based innovations. The United States attracts 71% of total investment, while Canada receives 29%. M&A activity has increased by 23%, with over 18 major deals recorded between 2023 and 2025, focusing on bio-based technologies and supply chain integration.
New Product Developments
Approximately 38% of new products launched in 2025 were bio-based colorants, offering performance improvements of 19% in UV resistance and 14% in shelf life. Innovation rates have increased by 27%, driven by R&D collaborations.
Recent Developments in North America Agricultural Colorants Market
- 2025: BASF increased production capacity by 15%, reaching 28,000 metric tons
- 2025: LANXESS invested USD 45 million in bio-based colorant production
Research Methodology
The research process involved comprehensive primary and secondary data collection across North America. Primary research included interviews with over 85 industry experts, manufacturers, and distributors. Secondary research involved analysis of company reports, regulatory data, and industry publications. Market size estimation utilized bottom-up and top-down approaches, incorporating production volumes exceeding 145,000 metric tons and revenue benchmarks. Data triangulation ensured accuracy, while forecasting models integrated historical data from 2022–2024 and current trends to project growth through 2034.
Frequently Asked Questions
Senior Market Research Analyst | 8 Years Experience | Precision Agriculture and AgriTech Platforms
Henry Smith is a market research analyst with 7–9 years of experience specializing in agriculture markets. Contributed to 70+ research reports for global clients. Expertise includes market sizing, forecasting, competitive analysis, and trend evaluation across key regions.