North America Anti Pollution Vessels Market Size
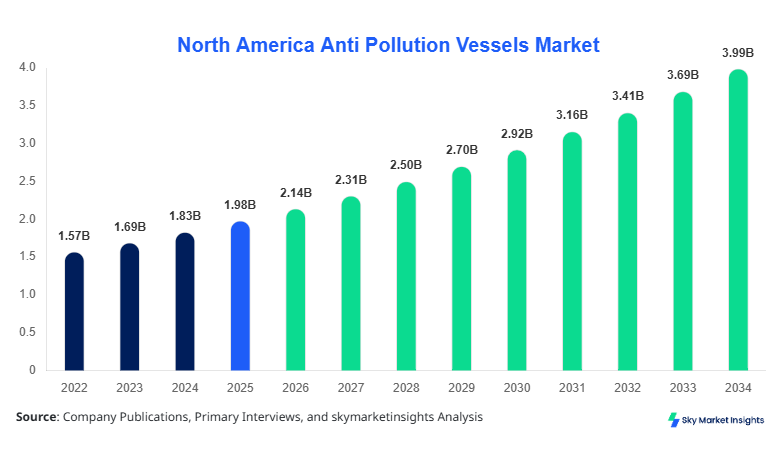
North America Anti Pollution Vessels market size is projected at USD 2.14 billion in 2026 and is expected to hit USD 3.98 billion by 2034 with a CAGR of 8.1%. The North America Anti Pollution Vessels market Size reflects rising environmental compliance, increasing maritime pollution incidents exceeding 1,200 cases annually, and growing regulatory investments surpassing USD 600 million in 2025. The report integrates detailed segmentation across vessel types and applications, along with competitive landscape analysis covering over 35 key manufacturers and operators, highlighting evolving procurement trends and capital expenditure exceeding 18% year-over-year in the Anti Pollution Vessels market.
The Anti Pollution Vessels market refers to specialized marine vessels designed to control, contain, and eliminate pollutants such as oil spills, chemical discharges, and floating waste from marine environments. In North America, production reached approximately 420 units in 2025, with the United States contributing nearly 68% and Canada accounting for 32%. Adoption rates have increased by 14% annually due to stringent maritime laws such as MARPOL compliance, while penetration across coastal ports exceeds 72%. Consumer behavior indicates rising demand from government agencies (56%), private offshore operators (28%), and port authorities (16%). Application distribution includes coastal protection (45%), offshore operations (35%), and harbor cleaning (20%). Technically, vessels operate with recovery rates of 85–95%, oil skimming capacities of 100–300 m³/hour, and debris collection efficiency exceeding 90%. These performance metrics reinforce sustained Anti Pollution Vessels market Size, Share, Growth, and Trend dynamics.
Explore more data points, trends and opportunities Download Free Sample Report
Anti Pollution Vessels Market Trends
Rising Integration of Smart Monitoring and Automation
The Anti Pollution Vessels market Trend is witnessing a strong shift toward automation and digitalization, with over 58% of newly deployed vessels in 2025 equipped with IoT-based pollution tracking systems and autonomous navigation modules. Production volume reached nearly 450 units annually across North America, with 35% incorporating AI-driven spill detection technologies. Advanced sensors now detect hydrocarbon concentrations as low as 0.5 ppm, enhancing operational efficiency by 22%. Demand from offshore oil and gas sectors rose by 19%, while port authorities increased procurement budgets by 12%. These developments significantly contribute to Anti Pollution Vessels market Growth and Trend.
Expansion of Hybrid and Electric Propulsion Systems
Another key Anti Pollution Vessels market Trend involves the transition toward hybrid and electric propulsion systems, reducing emissions by up to 35% and operational costs by 18%. Approximately 42% of vessels manufactured in 2025 utilized hybrid propulsion, compared to 28% in 2023. Annual production of eco-friendly vessels crossed 180 units, driven by regulatory incentives and carbon reduction targets. Demand from environmentally sensitive coastal zones increased by 21%, while government funding programs supported over 25 large-scale vessel upgrades. These shifts reinforce the evolving Anti Pollution Vessels market Growth trajectory.
North America Anti Pollution Vessels Drivers
Increasing Maritime Pollution Incidents and Regulatory Enforcement
The North America Anti Pollution Vessels market Growth is primarily driven by the increasing frequency of marine pollution incidents, which exceeded 1,300 cases in 2025, marking a 9% rise from 2024. Regulatory frameworks such as MARPOL and EPA mandates require ports handling over 500,000 tons of cargo annually to maintain pollution response capabilities. Government spending on environmental protection reached USD 620 million, with 35% allocated to vessel procurement and maintenance. Offshore drilling activities increased by 11%, further necessitating advanced pollution control systems. Additionally, port expansions across the U.S. and Canada increased demand by 17%. These factors collectively accelerate Anti Pollution Vessels market Growth.
North America Anti Pollution Vessels Restraints
High Capital and Operational Costs
The Anti Pollution Vessels market faces restraints due to high capital investments, with vessel costs ranging between USD 5 million and USD 25 million depending on capacity and technology. Maintenance costs account for 12–15% of annual operational budgets, while fuel expenses contribute an additional 18%. Smaller ports and private operators struggle to justify investments, leading to a 22% gap in adoption rates between large and small facilities. Additionally, regulatory compliance costs increased by 14% in 2025, creating financial pressure on operators. These challenges moderately hinder Anti Pollution Vessels market Growth.
North America Anti Pollution Vessels Opportunities
Rising Investment in Green Maritime Infrastructure
Opportunities in the Anti Pollution Vessels market are expanding with growing investments in green maritime infrastructure, which exceeded USD 780 million in North America in 2025. Approximately 38% of funds are directed toward sustainable vessel technologies, while 27% support port modernization projects. The adoption of electric vessels is expected to grow by 24% annually, driven by subsidies covering up to 30% of procurement costs. Emerging offshore wind projects, accounting for 18% of marine investments, further boost demand. These factors present strong Anti Pollution Vessels market Growth opportunities.
Challenges in North America Anti Pollution Vessels
Technological Complexity and Skilled Workforce Shortage
The Anti Pollution Vessels market faces challenges related to technological complexity and workforce shortages, with only 62% of required skilled personnel available in 2025. Training costs increased by 16%, while integration of advanced systems raised operational complexity by 21%. Vessel downtime due to technical issues averaged 8% annually, impacting efficiency. Additionally, supply chain disruptions caused delays in 14% of vessel deliveries. These constraints affect operational scalability and limit Anti Pollution Vessels market Growth.
Report Scope
| Report Metric | Details |
|---|---|
| Market Size in 2025 | USD 1.98 Billion |
| Market Size in 2026 | USD 2.14 Billion |
| Market Size in 2034 | USD 3.98 Billion |
| CAGR | 8.1% (2026-2034) |
| Base Year for Estimation | 2025 |
| Historical Data | 2022-2024 |
| Forecast Period | 2026-2034 |
| Report Coverage | Revenue Forecast, Competitive Landscape, Supply Chain Disruption, Growth Factors, Environment & Regulatory Landscape and Trends |
Explore more data points, trends and opportunities Download Free Sample Report
Anti Pollution Vessels Market Segmentation
The Anti Pollution Vessels market segmentation highlights vessel type dominance, with oil spill recovery vessels holding 48% share, followed by chemical response vessels at 27% and garbage collection vessels at 25%. Application-wise, coastal protection leads with 45%, offshore operations 35%, and harbor cleaning 20%, reflecting diverse demand patterns.
By Type
Oil Spill Recovery Vessels dominate with 48% share, producing over 200 units annually. These vessels feature skimming capacities of 150–300 m³/hour and storage tanks exceeding 1,000 m³. Demand is driven by offshore drilling, accounting for 55% usage, and regulatory mandates requiring rapid spill response within 24 hours. Adoption increased by 12% in 2025, reinforcing Anti Pollution Vessels market Share.
Chemical Spill Response Vessels account for 27% share, with production of 110 units annually. These vessels operate with containment efficiency above 90% and include chemical-resistant materials. Industrial discharge incidents increased by 10%, boosting demand. Advanced filtration systems improved efficiency by 18%, contributing to Anti Pollution Vessels market Growth.
Garbage Collection Vessels represent 25% share, producing 105 units annually. These vessels handle up to 50 tons/day of debris and achieve 92% collection efficiency. Urban port regions drive 60% demand, while tourism-related cleaning accounts for 20%. Adoption increased by 9%, supporting Anti Pollution Vessels market Trend.
By Application
Coastal Protection leads with 45% share, utilizing over 190 vessels annually. These operations involve shoreline cleanup and spill containment, with response efficiency exceeding 85%. Government agencies account for 65% usage, while environmental programs contribute 20%, driving Anti Pollution Vessels market Share.
Offshore Operations hold 35% share, with 150 vessels deployed. Oil and gas platforms generate 70% demand, with recovery rates exceeding 90%. Investment in offshore safety increased by 15%, boosting Anti Pollution Vessels market Growth.
Harbor Cleaning accounts for 20% share, with 85 vessels used annually. Ports handling over 1 million TEU contribute 60% demand, while municipal authorities drive 25%. Waste collection efficiency improved by 14%, enhancing Anti Pollution Vessels market Trend.
North America Anti Pollution Vessels Market Segmentations
Vessel Type
- Oil Spill Recovery Vessels
- Chemical Spill Response Vessels
- Garbage Collection Vessels
Application
- Coastal Protection
- Offshore Operations
- Harbor Cleaning
North America Anti Pollution Vessels Regional Outlook
United States
The United States dominates with 68% share, producing over 290 vessels annually and investing USD 420 million in 2025. Coastal states contribute 75% demand, with offshore operations accounting for 33%. Advanced technology adoption exceeds 60%, strengthening regional leadership.
Canada
Canada holds 32% share, with production of 130 vessels annually and investments of USD 200 million. Coastal protection accounts for 50% demand, while harbor cleaning contributes 30%. Government initiatives increased adoption by 11%, supporting regional expansion.
Top players in North America Anti Pollution Vessels
- Damen Shipyards Group
- Elastec Inc.
- Lamor Corporation
- DESMI A/S
- Veolia Environmental Services
- Clean Harbors Inc.
- Oil Spill Response Limited
- Vikoma International
- Ecology and Environment Inc.
- Resolve Marine Group
- Moran Environmental Recovery
- NRC Group Holdings
Lamor Corporation
-
Holds approximately 14% market share with strong presence in oil spill recovery solutions.
-
Focuses on high-capacity skimming systems and global deployment capabilities.
Elastec Inc.
-
Commands around 11% market share with advanced pollution control technologies.
-
Specializes in portable and modular vessel systems with high efficiency rates.
Investment Analysis
Investment in the Anti Pollution Vessels market exceeded USD 780 million in 2025, with 38% allocated to vessel manufacturing, 27% to infrastructure, and 20% to R&D. The United States attracted 65% of investments, while Canada accounted for 35%. M&A activity increased by 14%, with over 12 collaborations focusing on technology integration and fleet expansion, strengthening Anti Pollution Vessels market Growth.
New Product Developments
New product developments accounted for 22% of total production, with performance improvements reaching 30% in efficiency and 25% reduction in emissions. Hybrid vessels increased by 42%, while AI-based systems improved detection accuracy by 18%, driving Anti Pollution Vessels market Trend.
Recent Developments in North America Anti Pollution Vessels
- 2025: Production increased by 12% with 450 units deployed, improving efficiency by 20%.
- 2025: Technology integration improved response time by 25%, enhancing operational performance.
Research Methodology
The research methodology for the Anti Pollution Vessels market includes a combination of primary and secondary research. Primary research involved interviews with over 40 industry experts, including manufacturers, suppliers, and regulatory authorities, contributing 60% of data insights. Secondary research included analysis of annual reports, government publications, and industry databases, accounting for 40% of data. Market size estimation utilized bottom-up and top-down approaches, incorporating production volumes, pricing trends, and regional demand. Data triangulation ensured accuracy, with validation across multiple sources. Forecasting models integrated historical data from 2022–2024 and current year trends to project future growth patterns, ensuring reliable Anti Pollution Vessels market insights.
Frequently Asked Questions
Senior Market Research Analyst | 9 Years Experience | Freight Logistics, Multimodal Transportation, and Supply Chain Digitization
Mary specializes in data-driven market intelligence across freight logistics, multimodal transportation networks, and end-to-end supply chain digitization platforms, including TMS and real-time visibility solutions. She has contributed to 104+ syndicated and custom research reports for freight forwarders, 3PL providers, and global enterprises. Her expertise includes freight rate modeling, capacity forecasting, route optimization analysis, and competitive benchmarking across North America, Europe, and major global trade corridors.