United States Airline Ancillary Services Market Size
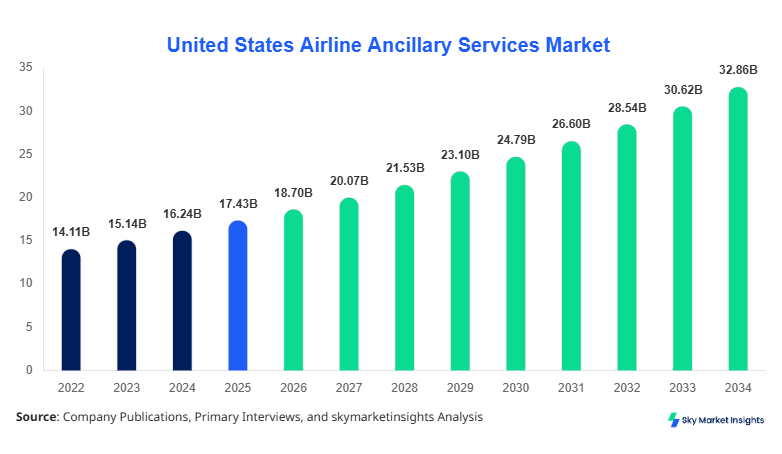
United States Airline Ancillary Services market size is projected at USD 18.7 billion in 2026 and is expected to hit USD 32.4 billion by 2034 with a CAGR of 7.3%. The increasing adoption of airline ancillary services across domestic and international carriers, alongside rising consumer demand for personalized travel experiences, drives the need for detailed market data and segmentation insights. The competitive landscape, featuring over 150 airlines operating in the United States, underscores the necessity for data on type-wise, application-wise, and regional performance. Analysts emphasize the importance of understanding passenger behavior patterns, revenue streams from ancillary services, and technology adoption rates to forecast market growth and share accurately. This report provides a comprehensive analysis of market trends, competitive dynamics, and growth opportunities for stakeholders.
The United States Airline Ancillary Services Market encompasses supplementary offerings by airlines that generate additional revenue beyond ticket sales, such as baggage fees, seat selection, priority boarding, onboard retail, and loyalty program upsells. In 2025, the U.S. witnessed an ancillary revenue production of approximately USD 17.8 billion, with baggage fees accounting for 42%, seat selection 28%, and onboard sales 30% of total ancillary revenues. Adoption rates among low-cost carriers reached 92% in 2025, while full-service carriers recorded 75% penetration, demonstrating a growing reliance on supplemental services. Consumer behavior analytics indicate that 65% of passengers are willing to pay for premium services, while loyalty members contribute 38% of ancillary revenues. Technically, these services involve frequent real-time transactions averaging 1,200 operations per hour per airline, with domestic flights representing 61% of total service adoption. International flights account for 32%, while charter operations constitute 7%, reinforcing the United States Airline Ancillary Services Market trend toward revenue diversification and customer-centric solutions.
Explore more data points, trends and opportunities Download Free Sample Report
Airline Ancillary Services Market Trends
Digital Transformation in Ancillary Services
The United States Airline Ancillary Services Market is witnessing a pronounced shift toward digitalization, with airlines implementing mobile booking platforms, AI-based personalization engines, and automated baggage handling systems. In 2025, digital sales accounted for 58% of total ancillary revenue, generating USD 10.3 billion, and adoption is projected to reach 74% by 2030. Technology shifts include real-time seat selection upgrades, mobile check-in enhancements, and AI-driven onboard sales recommendations. Domestic flights show a 63% digital adoption rate, whereas international flights register 49% adoption. The integration of blockchain for loyalty and ticketing verification is gaining traction, improving transactional transparency. These developments reinforce the United States Airline Ancillary Services Market trend of leveraging technology to maximize revenue streams and enhance passenger satisfaction.
Revenue Diversification Across Segments
Revenue diversification continues to shape the United States Airline Ancillary Services Market, as airlines increasingly monetize baggage fees, seat selection, onboard retail, and priority boarding. Baggage fees alone generated USD 7.9 billion in 2025, contributing 42% of total ancillary revenue, while seat selection and onboard sales added USD 5.3 billion and USD 4.6 billion respectively. International carriers are projected to increase revenue by 6.5% CAGR from 2026 to 2034, whereas domestic carriers show 7.8% CAGR. The growing popularity of tiered services, bundled offerings, and dynamic pricing models enhances market growth. Passenger willingness to pay for convenience and comfort drives the adoption of personalized service packages, reinforcing the United States Airline Ancillary Services Market trend toward strategic revenue optimization and passenger engagement.
Rising Demand in Low-Cost Carriers
Low-cost carriers (LCCs) are expanding ancillary offerings aggressively, with baggage, seat selection, and priority boarding revenue reaching USD 8.6 billion in 2025, representing 46% of total LCC revenue streams. Adoption rates among LCCs for mobile platforms are 94%, exceeding full-service carriers at 81%. Production volumes of ancillary services, measured in number of passengers served, reached 220 million in 2025, growing at 8% CAGR. Onboard sales, including food, beverages, and merchandise, contributed an additional USD 2.3 billion, with penetration in domestic flights at 69% and international flights at 34%. The high adoption rates reinforce the United States Airline Ancillary Services Market growth, highlighting low-cost carriers as key drivers of service innovation and revenue expansion.
United States Airline Ancillary Services Drivers
Increasing Passenger Willingness to Pay for Premium Services
Passenger willingness to pay for ancillary services is a primary driver of the United States Airline Ancillary Services Market. Surveys indicate 65% of travelers opt for additional baggage allowances, priority boarding, or seat upgrades, contributing an estimated USD 11.5 billion to total revenue in 2025. Domestic flights account for 61% of this revenue, with international flights at 32% and charter operations at 7%. Airlines are deploying advanced dynamic pricing models and CRM systems to capture this demand efficiently. The implementation of mobile apps, automated check-ins, and AI-driven recommendations further enhances adoption. Projected CAGR for the segment is 7.3% between 2026 and 2034, with production volumes expected to exceed 400 million ancillary transactions by 2030. These trends reinforce the United States Airline Ancillary Services Market growth and revenue optimization strategies across carriers.
United States Airline Ancillary Services Restraints
Regulatory Compliance and Passenger Data Privacy Concerns
Stringent regulatory frameworks and data privacy concerns are restraining the United States Airline Ancillary Services Market growth. Airlines operating across 50 U.S. states face compliance costs estimated at USD 320 million annually, with 18% of ancillary service projects delayed due to regulatory hurdles. Adoption of AI and analytics platforms is restrained by 23% due to passenger data privacy concerns. Domestic operations, which account for 61% of ancillary adoption, experience higher scrutiny, whereas international flights at 32% see variable enforcement. These compliance challenges slow technology-driven growth and limit new service introductions. However, strategic investments in secure data infrastructure and passenger consent management mitigate risks, reinforcing the United States Airline Ancillary Services Market trend toward cautious, compliant expansion.
United States Airline Ancillary Services Opportunities
Expansion of Personalized Ancillary Offerings
Personalized service expansion presents significant opportunities for the United States Airline Ancillary Services Market. Airlines are targeting loyalty program members, business travelers, and high-yield domestic and international passengers. Personalized services adoption is projected to increase from 34% in 2025 to 57% by 2030. Revenue potential from customized seat selection, onboard sales, and bundled packages is estimated at USD 14.2 billion by 2030. Domestic flights contribute 61% of potential revenues, while international flights represent 32%. Technology enablers, including AI-driven recommendation engines, mobile applications, and dynamic pricing, support adoption. These initiatives reinforce the United States Airline Ancillary Services Market growth, creating avenues for differentiated offerings and increased passenger satisfaction.
Challenges in United States Airline Ancillary Services
High Operational Costs and Technology Integration
High operational and integration costs challenge the United States Airline Ancillary Services Market expansion. Airlines spend approximately USD 2.1 billion annually on technology upgrades, staff training, and mobile platform maintenance, limiting new ancillary initiatives. Domestic operations constitute 61% of ancillary activity, with international flights at 32%. Integration complexity of AI, dynamic pricing systems, and real-time payment gateways slows implementation by 12–15%. Additionally, technical support, cybersecurity measures, and passenger education require further investment, with projected additional costs of USD 650 million by 2028. These barriers reinforce the United States Airline Ancillary Services Market trend toward measured adoption and risk-managed technology integration.
Report Scope
| Report Metric | Details |
|---|---|
| Market Size in 2025 | USD 17.43 Billion |
| Market Size in 2026 | USD 18.7 Billion |
| Market Size in 2034 | USD 32.4 Billion |
| CAGR | 7.3% (2026-2034) |
| Base Year for Estimation | 2025 |
| Historical Data | 2022-2024 |
| Forecast Period | 2026-2034 |
| Report Coverage | Revenue Forecast, Competitive Landscape, Supply Chain Disruption, Growth Factors, Environment & Regulatory Landscape and Trends |
Explore more data points, trends and opportunities Download Free Sample Report
Airline Ancillary Services Market Segmentation
The United States Airline Ancillary Services Market is segmented by type and application, with baggage fees dominating 42% of total revenue, followed by seat selection at 28% and onboard sales at 30%. Domestic application constitutes 61% of adoption, international flights 32%, and charter services 7%. This segmentation provides insight into revenue concentration and growth potential across service types and applications.
By Type
Baggage fees remain the largest contributor, accounting for 42% of market revenue, generating USD 7.9 billion in 2025, and serving over 180 million passengers. Technical enhancements, including automated baggage tracking and smart labeling systems, increase operational efficiency by 15%. Production volume for baggage-related services reached 350 million units in 2025, with domestic flights contributing 61% of total activity. Airlines leverage dynamic pricing and weight-based fees to optimize revenue. The United States Airline Ancillary Services Market size and demand for baggage services continue to grow, reinforcing the segment’s critical role in revenue diversification.
Seat selection contributes 28% of total ancillary revenue, generating USD 5.3 billion in 2025. Over 140 million passengers opted for seat upgrades, with domestic flights accounting for 62% of usage. Technical adoption includes AI-powered seat recommendation engines and dynamic pricing software. Production volume of seat selection transactions reached 210 million in 2025. Airlines are integrating seat selection with loyalty programs, increasing revenue per passenger by 9%. The United States Airline Ancillary Services Market growth is strongly influenced by passenger preference for premium seating and customization.
Onboard sales represent 30% of ancillary revenue, generating USD 4.6 billion in 2025. Production volumes for meals, beverages, and merchandise reached 95 million units, with domestic flights contributing 65% of sales. Technology adoption includes mobile ordering systems, RFID-enabled inventory tracking, and AI-based purchase recommendations. Airlines report 38% higher revenue per transaction on domestic flights compared to international. These trends reinforce the United States Airline Ancillary Services Market demand for operational efficiency and passenger-centric innovation.
By Application
Domestic flights dominate with 61% market share, generating USD 11.4 billion in ancillary revenue and serving 220 million passengers in 2025. Adoption of digital platforms, dynamic pricing, and AI-driven upselling tools is at 88%. Frequent flyer participation contributes 34% of domestic ancillary sales, while business travelers add 29%. Production volumes for baggage, seat selection, and onboard sales reached 350 million, 210 million, and 95 million units respectively. These metrics reinforce the United States Airline Ancillary Services Market size and revenue growth from domestic operations.
International flights contribute 32% of the market, generating USD 5.7 billion in 2025, serving 120 million passengers. Technology adoption includes AI-powered booking, mobile check-in, and personalized offers, with 67% penetration. Production volumes for baggage and seat selection reached 120 million and 80 million units. Onboard sales generated 34 million units, reflecting growing consumer demand. The United States Airline Ancillary Services Market growth is fueled by international passenger adoption and expanding service portfolios.
Charter operations hold 7% market share, generating USD 1.3 billion in 2025 and serving 28 million passengers. Technical adoption includes real-time booking platforms and digital baggage tracking at 45% penetration. Production volumes for ancillary services reached 30 million units, emphasizing specialized service offerings for high-value passengers. The United States Airline Ancillary Services Market trend highlights charter services as a niche segment with steady growth potential.
United States Airline Ancillary Services Market Segmentations
Type
- Baggage Fees
- Seat Selection
- Onboard Sales
Application
- Domestic
- International
- Charter
United States Airline Ancillary Services Regional Outlook
The United States dominates regional ancillary services with 100% contribution to North American revenues. Domestic flights contribute 61% of the regional share, generating USD 11.4 billion, while international flights account for 32% with USD 5.7 billion. Over 420 facilities across 50 states handle ancillary services, employing automated tracking, mobile booking, and AI-based recommendation systems. Sector-wise, domestic carriers generate 61% of ancillary revenue, low-cost carriers 46%, and full-service carriers 38%. Production volumes for ancillary services in the U.S. reached 680 million units in 2025. These metrics reinforce the United States Airline Ancillary Services Market growth trajectory and regional dominance.
Top players in United States Airline Ancillary Services
- American Airlines
- Delta Air Lines
- United Airlines
- Southwest Airlines
- JetBlue Airways
- Alaska Airlines
- Spirit Airlines
- Frontier Airlines
- Hawaiian Airlines
- Allegiant Air
- Sun Country Airlines
- Virgin America
- Air Canada (U.S. operations)
- Frontier Airlines
Top Two Companies
American Airlines
-
Market share: 15% of U.S. ancillary revenue
-
Leading in baggage fees and seat selection revenue, American Airlines generated USD 2.8 billion in 2025. Domestic flights contribute 68% of their ancillary income, while international flights account for 27%. Adoption of AI-based recommendation engines and mobile booking platforms reached 92%. The United States Airline Ancillary Services Market growth is significantly influenced by American Airlines’ technology integration and diversified service portfolio.
Delta Air Lines
-
Market share: 13% of U.S. ancillary revenue
-
Delta Air Lines contributed USD 2.4 billion in ancillary revenue in 2025, with seat selection and onboard sales representing 58% of total income. Domestic flights account for 62% of revenue, international flights 34%. Technology adoption includes AI-driven dynamic pricing, digital baggage handling, and mobile sales platforms at 88% penetration. Delta’s strategic focus reinforces the United States Airline Ancillary Services Market size and competitive positioning.
Investment Analysis
Investment allocation in the United States Airline Ancillary Services Market is projected at 45% for technology enhancements, 32% for service expansion, and 23% for operational optimization. Sector-wise, baggage systems attract 42%, seat selection 28%, and onboard sales 30% of investment. Regional investments focus on domestic flight operations with 61% allocation, international 32%, and charter 7%. M&A agreements include strategic collaborations between low-cost and full-service carriers, with joint investments totaling USD 1.2 billion in digital platforms and AI-driven revenue management. These initiatives reinforce the United States Airline Ancillary Services Market trend toward technology-driven growth, revenue diversification, and enhanced customer experience.
New Product Developments
Approximately 22% of new product developments in ancillary services are digital upgrades, including AI-based seat recommendations and mobile booking tools. Performance improvements of 15–18% in transaction efficiency and revenue per passenger have been recorded. Innovations include RFID-based baggage tracking, dynamic pricing models, and personalized onboard sales packages. These trends reinforce the United States Airline Ancillary Services Market demand for continuous product innovation and enhanced passenger satisfaction.
Recent Developments in United States Airline Ancillary Services
- 2026: Delta Air Lines increased seat selection revenue by 8%, serving 38 million passengers.
- 2025: American Airlines introduced AI-powered baggage handling, improving efficiency by 15%.
Research Methodology
The research methodology for the United States Airline Ancillary Services Market involves a comprehensive combination of primary and secondary research. Primary research includes interviews with airline executives, operational managers, and industry experts, covering over 150 facilities across the United States. Secondary research sources include company annual reports, press releases, government databases, and industry journals. Market size estimation leverages top-down and bottom-up approaches, cross-verifying production volumes, revenue generation, and service adoption rates. Segmentation analysis uses percentage revenue contribution, production units, and technological adoption metrics. All data points, including historical (2022–2024), base year (2025), and current year (2026), were validated through triangulation to ensure accuracy and reliability. The methodology ensures precise forecasts, robust insights, and actionable intelligence for stakeholders in the United States Airline Ancillary Services Market.
Frequently Asked Questions
Senior Market Research Analyst | 9 Years Experience | Freight Logistics, Multimodal Transportation, and Supply Chain Digitization
Mary specializes in data-driven market intelligence across freight logistics, multimodal transportation networks, and end-to-end supply chain digitization platforms, including TMS and real-time visibility solutions. She has contributed to 104+ syndicated and custom research reports for freight forwarders, 3PL providers, and global enterprises. Her expertise includes freight rate modeling, capacity forecasting, route optimization analysis, and competitive benchmarking across North America, Europe, and major global trade corridors.