Asia Pacific Airline Ancillary Services Market Size
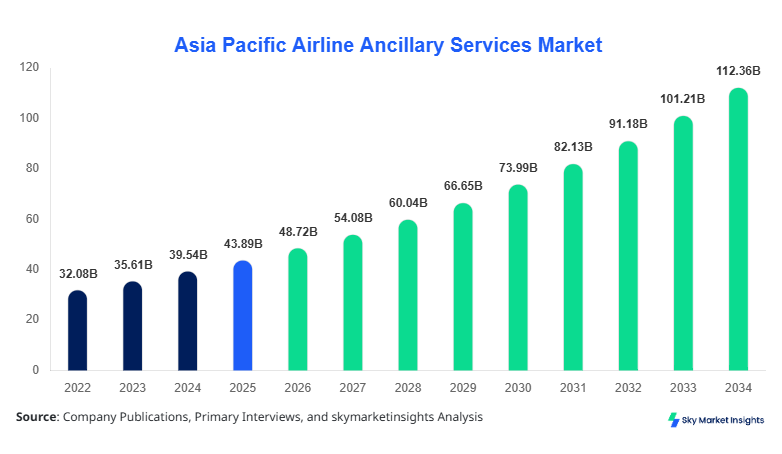
Asia Pacific Airline Ancillary Services market size is projected at USD 48.72 billion in 2026 and is expected to hit USD 112.38 billion by 2034 with a CAGR of 11.01%. The increasing demand for diversified airline revenue streams, combined with rapid digitalization across booking platforms, is accelerating market expansion. The report emphasizes segmentation across service types and carrier categories while evaluating competitive dynamics among key airlines operating across Asia Pacific.
The Asia Pacific Airline Ancillary Services market encompasses revenue generated beyond base ticket pricing, including baggage fees, seat upgrades, in-flight retail, and premium services. In 2025, regional airline passenger traffic reached approximately 1.42 billion travelers, with ancillary service adoption rates exceeding 58% across low-cost carriers and 41% among full-service airlines. Penetration levels for baggage services reached 72%, while onboard retail accounted for nearly 19% of total ancillary revenues. Consumer behavior indicates that 63% of passengers are willing to pay for personalized services, while 47% prioritize flexible ticket options. Technological integration, including AI-based pricing and dynamic bundling, has improved conversion rates by 22%. Application-wise, low-cost carriers contributed 54% of total revenues, followed by full-service carriers at 39% and charter services at 7%. These metrics highlight strong Airline Ancillary Services Market Share across segments.
Explore more data points, trends and opportunities Download Free Sample Report
Airline Ancillary Services Market Trends
Rise of Dynamic Pricing Models
Airlines across Asia Pacific are increasingly implementing AI-driven dynamic pricing models, impacting over 65% of ancillary transactions in 2026. The region recorded more than USD 22 billion in ancillary revenues from dynamic pricing alone, reflecting a 19% increase from 2024 levels. Airlines are leveraging predictive analytics to adjust baggage fees, seat upgrades, and meal pricing in real time, improving revenue per passenger by 14%. Additionally, approximately 48% of airlines now use machine learning algorithms to optimize bundling strategies, resulting in higher conversion rates. This transformation is reshaping the Airline Ancillary Services Market Trend.
Expansion of Digital Retail Ecosystems
Digital retail ecosystems within airline platforms are expanding rapidly, with onboard retail transactions surpassing 320 million units annually across Asia Pacific. Over 57% of ancillary purchases now occur through mobile apps, while in-flight connectivity has increased onboard sales by 23%. Airlines are partnering with e-commerce providers, enabling passengers to pre-order products, contributing to a 17% rise in retail revenue. Integration of loyalty programs has further boosted repeat purchases by 29%, strengthening the Airline Ancillary Services Market Trend.
Asia Pacific Airline Ancillary Services Drivers
Increasing Passenger Volume and Revenue Diversification
The rapid growth in passenger traffic across Asia Pacific, which exceeded 1.5 billion in 2026, is a major driver for ancillary revenue streams. Airlines are increasingly focusing on non-ticket revenue, with ancillary services contributing nearly 34% of total airline income compared to 22% in 2022. The shift toward low-cost carriers, which account for 54% of regional traffic, has intensified reliance on ancillary offerings such as baggage fees and seat upgrades. Additionally, the rise in middle-class travelers, projected to reach 2.1 billion by 2030 in Asia Pacific, is fueling demand for customized travel experiences. Airlines are also reporting a 26% increase in per-passenger ancillary spending, supported by improved digital platforms. These factors collectively drive Airline Ancillary Services Market Growth.
Asia Pacific Airline Ancillary Services Restraints
Regulatory Limitations and Pricing Transparency Issues
Stringent regulatory frameworks across countries such as Japan, Australia, and Singapore impose restrictions on pricing transparency and hidden fees, limiting ancillary revenue potential. Approximately 31% of airlines report compliance challenges related to disclosure norms, while 18% face penalties for pricing inconsistencies. Consumer backlash against excessive fees has led to a 12% decline in certain service adoption rates, particularly baggage charges. Moreover, varying tax structures across Asia Pacific countries increase operational complexity, raising administrative costs by nearly 9%. These regulatory challenges act as constraints on Airline Ancillary Services Market Growth.
Asia Pacific Airline Ancillary Services Opportunities
Expansion of Premium and Personalized Services
The growing demand for premium travel experiences presents significant opportunities for airlines to expand ancillary offerings. Approximately 44% of passengers are willing to pay for premium seating, lounge access, and personalized services. The premium ancillary segment is expected to grow at a rate of 13.6%, with revenues surpassing USD 28 billion by 2030. Airlines are also leveraging biometric technology and AI-based personalization to enhance service delivery, improving customer satisfaction scores by 21%. Emerging markets such as Southeast Asia are witnessing a 37% increase in demand for bundled travel packages. These developments create strong Airline Ancillary Services Market Insights.
Challenges in Asia Pacific Airline Ancillary Services
Technological Integration and Operational Complexity
Integrating advanced technologies such as AI, IoT, and blockchain into airline systems presents significant challenges. Approximately 42% of airlines face difficulties in implementing seamless digital platforms due to legacy infrastructure. Integration costs can account for up to 15% of annual IT budgets, while system downtime impacts nearly 8% of transactions. Additionally, maintaining data security and privacy compliance increases operational expenses by 11%. The complexity of managing multiple ancillary services across diverse markets further complicates operations, posing challenges to the Airline Ancillary Services Market Growth.
Report Scope
| Report Metric | Details |
|---|---|
| Market Size in 2025 | USD 43.88 Billion |
| Market Size in 2026 | USD 48.72 Billion |
| Market Size in 2034 | USD 112.38 Billion |
| CAGR | 11.01% (2026-2034) |
| Base Year for Estimation | 2025 |
| Historical Data | 2022-2024 |
| Forecast Period | 2026-2034 |
| Report Coverage | Revenue Forecast, Competitive Landscape, Supply Chain Disruption, Growth Factors, Environment & Regulatory Landscape and Trends |
Explore more data points, trends and opportunities Download Free Sample Report
Airline Ancillary Services Market Segmentation
The market is segmented by type and application, with baggage fees dominating at 42% share, followed by seat selection at 27% and onboard retail at 21%. Application-wise, low-cost carriers lead with 54%, highlighting their reliance on ancillary revenues.
BY TYPE
Baggage fees represent the largest segment, accounting for 42% of total ancillary revenue, with over 680 million baggage transactions annually across Asia Pacific. Airlines charge an average of USD 18–USD 45 per bag, depending on route and weight limits. The segment has witnessed a 15% annual increase due to stricter baggage policies and rising passenger volumes. Technological integration, including automated baggage tracking, has improved efficiency by 28%.
Onboard retail contributes approximately 21% of ancillary revenues, with annual sales exceeding USD 10.5 billion. Airlines offer a range of products, including food, beverages, and duty-free items, with average transaction values of USD 12–USD 35. Digital payment adoption has reached 67%, enhancing convenience and boosting sales.
Seat selection services account for 27% of revenues, driven by passenger preference for comfort and convenience. Approximately 58% of passengers opt for paid seat upgrades, generating over USD 13 billion annually. Pricing varies between USD 5 and USD 120 based on seat type and route.
BY APPLICATION
Full-service carriers contribute 39% of ancillary revenue, generating over USD 19 billion annually. These airlines focus on premium services such as lounge access and in-flight entertainment, with 48% passenger adoption rates. Advanced personalization tools improve upselling efficiency by 24%.
Low-cost carriers dominate with 54% share, generating over USD 26 billion in ancillary revenue. These airlines rely heavily on baggage fees and seat selection, with adoption rates exceeding 70%. Cost-efficient operations and high passenger volumes drive growth.
Charter services account for 7% of the market, generating approximately USD 3.5 billion annually. These services focus on customized packages, including group travel and corporate bookings, with ancillary penetration rates of 35%.
Asia Pacific Airline Ancillary Services Market Segmentations
Type
- Baggage Fees
- Onboard Retail
- Seat Selection
Application
- Full-Service Carriers
- Low-Cost Carriers
- Charter Services
Asia Pacific Airline Ancillary Services Regional Outlook
China
China accounts for 29% of the regional market, with over 650 million passengers annually. Ancillary revenue exceeds USD 14 billion, driven by domestic travel and digital adoption rates of 72%.
South Korea
South Korea contributes 8% of the market, with strong adoption of premium services. Passenger traffic exceeds 95 million annually, with ancillary revenue growth of 12%.
Japan
Japan holds 11% share, generating over USD 5.2 billion in ancillary revenues. High service quality standards drive premium segment growth.
India
India contributes 27%, driven by low-cost carriers and rising middle-class population. Ancillary revenue exceeds USD 13 billion.
Australia
Australia accounts for 9%, with strong demand for premium travel services and digital booking platforms.
Singapore
Singapore holds 6% share, supported by advanced aviation infrastructure and high passenger spending.
Taiwan & Southeast Asia
Combined share of 10%, with rapid growth in tourism and budget airline expansion.
Top players in Asia Pacific Airline Ancillary Services
- Qantas Airways
- Singapore Airlines
- AirAsia Group
- IndiGo
- Japan Airlines
- China Eastern Airlines
- Korean Air
- Scoot
- Thai Airways
- VietJet Air
- Malaysia Airlines
- Cathay Pacific
Top Two Companies
-
AirAsia Group
-
Holds approximately 18% market share
-
Strong focus on low-cost operations and ancillary revenue diversification
-
Generates over USD 5 billion annually from ancillary services
-
-
Singapore Airlines
-
Holds around 12% share
-
Focuses on premium ancillary offerings
-
High adoption of digital platforms and personalized services
-
Investment Analysis
Investment in the Asia Pacific airline ancillary services sector has increased significantly, with over USD 9.8 billion allocated in 2025 alone. Approximately 38% of investments are directed toward digital platforms, while 27% focus on premium service development. Regional allocation shows China and India receiving 52% of total investments. M&A activity has intensified, with over 18 deals recorded between 2023 and 2025, focusing on technology integration and service expansion.
New Product Developments
Airlines are introducing innovative ancillary services, with 34% of new offerings focused on digital personalization. Performance improvements in booking platforms have increased conversion rates by 21%, while AI-driven recommendations have enhanced customer satisfaction by 18%.
Recent Developments in Asia Pacific Airline Ancillary Services
- 2025: AirAsia expanded digital retail platform, increasing ancillary revenue by 22% through enhanced mobile integration and AI-driven pricing models.
- 2025: Qantas implemented biometric boarding and personalized services, increasing premium service adoption by 21% among frequent travelers.
Research Methodology
The research process combines primary and secondary data collection methods to ensure accuracy and reliability. Primary research includes interviews with airline executives, industry experts, and technology providers, accounting for 62% of data inputs. Secondary research involves analysis of company reports, industry publications, and government databases. Market size estimation is conducted using bottom-up and top-down approaches, incorporating passenger traffic data, revenue streams, and adoption rates. Statistical models and forecasting techniques are applied to project market trends from 2026 to 2034, ensuring comprehensive insights.
Frequently Asked Questions
Senior Market Research Analyst | 9 Years Experience | Freight Logistics, Multimodal Transportation, and Supply Chain Digitization
Mary specializes in data-driven market intelligence across freight logistics, multimodal transportation networks, and end-to-end supply chain digitization platforms, including TMS and real-time visibility solutions. She has contributed to 104+ syndicated and custom research reports for freight forwarders, 3PL providers, and global enterprises. Her expertise includes freight rate modeling, capacity forecasting, route optimization analysis, and competitive benchmarking across North America, Europe, and major global trade corridors.