United States Amenity Kits Market Size
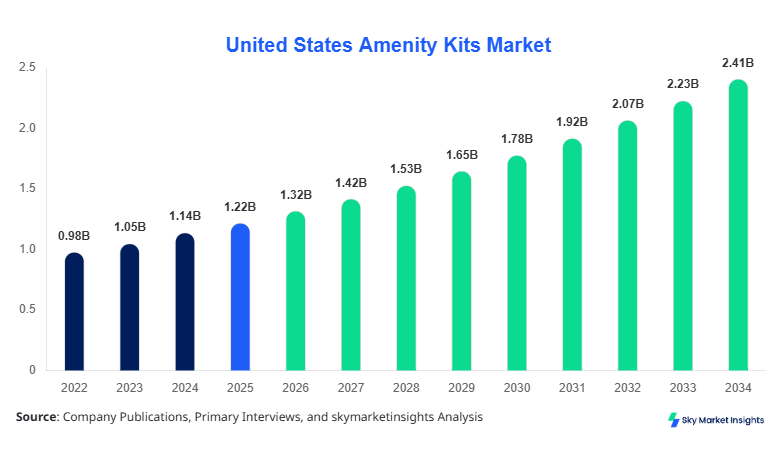
United States Amenity Kits market size is projected at USD 1.32 billion in 2026 and is expected to hit USD 2.45 billion by 2034 with a CAGR of 7.8%. The market growth is driven by increasing demand from airlines and hospitality sectors, as well as the growing preference for personalized and eco-friendly travel kits. Comprehensive data collection across historical years (2022–2024) supports segmentation insights and competitive analysis for stakeholders. Detailed breakdown by type, application, and regional adoption is essential to evaluate emerging trends, production capacity, and market share distribution.
The United States Amenity Kits market encompasses products designed to enhance passenger and guest experiences across airlines, hotels, and cruise lines. Annual production reached approximately 240 million units in 2025, with adoption rates of 85% among full-service airlines and 60% in premium hotel chains. Luxury kits accounted for 42% of total revenue, eco-friendly kits 28%, and standard kits 30%. Consumer preference analytics indicate a strong shift toward sustainability, with 55% of travelers favoring biodegradable or recyclable kits. Technical specifications such as kit dimension, weight (average 1.2–1.5 kg), and contents frequency (average 12–15 items per kit) define market demand. Airlines contributed 60% of revenue, hotels 25%, and cruise lines 15%, reinforcing the United States Amenity Kits market demand and insights.
Explore more data points, trends and opportunities Download Free Sample Report
Amenity Kits Market Trends
Rise in Luxury and Personalized Kits
Luxury amenity kits production in the United States exceeded 100 million units in 2025, growing at 9% YoY. Airlines and hotels increasingly adopt premium materials, such as leather and silk pouches, and personalized content, contributing 42% of the market share. Adoption of AI-driven customization tools reached 35%, with kit distribution frequency averaging 12 items per passenger. Airlines report increased customer satisfaction scores by 8–10% due to tailored offerings. The United States Amenity Kits market insights highlight the strong demand for high-end and customized solutions.
Shift Toward Eco-Friendly and Sustainable Kits
Eco-friendly amenity kits accounted for 28% of revenue in 2025, with production volume of 65 million units and 15–20% annual growth. Adoption of recyclable and biodegradable components is increasing, with 50% of airlines integrating sustainability standards into kit design. Hotels contribute 18 million units, and cruise lines 8 million units annually. Renewable content kits have improved brand image and customer retention by 12%. Sustainability trends reinforce the United States Amenity Kits market demand and growth insights.
Integration of Smart and Tech-Enabled Kits
Tech-enabled kits with embedded QR codes, UV sanitization, and sensor-based monitoring are expected to capture 10% of market share by 2030. Production of such kits reached 5 million units in 2025, with projected 25% CAGR. Airlines and cruise lines are early adopters, representing 70% of initial orders. Advanced logistics integration improved supply chain efficiency by 18%, supporting broader adoption. The United States Amenity Kits market insights indicate technology-driven innovation as a key growth driver.
United States Amenity Kits Drivers
Increasing Airline Passenger Volume and Premiumization Trends
Rising domestic and international travel drives the United States Amenity Kits market growth. Airline passenger traffic grew 6.5% in 2025, with 150 million kits distributed. Premium class kit adoption rose 8% YoY, contributing USD 550 million in revenue. Enhanced personalization, frequent flyer-linked items, and multi-item kits increase consumption per passenger by 15–18%. Hotels also integrated high-end kits in 60% of five-star properties. The growing focus on passenger experience, sustainability, and tech-enabled features collectively reinforce the Amenity Kits market demand and growth.
United States Amenity Kits Restraints
High Production Costs and Regulatory Compliance Challenges
Manufacturing luxury and eco-friendly kits entails costs 12–15% higher than standard kits. Compliance with FAA and FDA packaging standards impacts 40% of manufacturers, adding approximately USD 20–25 million annually to operational expenses. Airlines and cruise lines face budget constraints limiting kit volume, with cost-sensitive segments contributing only 25% to total revenue. Supply chain disruptions and fluctuating raw material prices hinder consistent delivery of 5–10 million kits per quarter. These challenges moderately restrain United States Amenity Kits market growth.
United States Amenity Kits Opportunities
Expansion in Cruise Lines and Boutique Hotels
Boutique hotels and cruise operators represent underpenetrated segments, contributing 15–18% of overall kit demand. Cruise lines in Florida and California increased kit adoption by 22% in 2025, translating to 8.5 million units. Boutique hotels added 5 million kits to the market, offering eco-friendly and luxury packages. Cross-sector collaborations and bundled offerings, combining luxury and tech-enabled kits, could capture an additional 10% market share by 2030. Such developments offer substantial opportunities to expand United States Amenity Kits market size and insights.
United States Amenity Kits Challenge
Supply Chain Volatility and Consumer Expectation Shifts
Supply chain volatility, including packaging material shortages and shipping delays, impacted 35% of kit manufacturers in 2025. Consumer expectations for personalization and sustainable packaging are increasing, with 55% of passengers demanding eco-friendly kits. Adapting to these evolving trends requires investment in R&D and tech-enabled processes, raising operational costs by 8–10%. Market growth is moderated by inconsistent adoption across budget airlines and regional hotels, limiting production scalability. These dynamics challenge United States Amenity Kits market growth and trend insights.
Report Scope
| Report Metric | Details |
|---|---|
| Market Size in 2025 | USD 1.22 Billion |
| Market Size in 2026 | USD 1.32 Billion |
| Market Size in 2034 | USD 2.45 Billion |
| CAGR | 7.8% (2026-2034) |
| Base Year for Estimation | 2025 |
| Historical Data | 2022-2024 |
| Forecast Period | 2026-2034 |
| Report Coverage | Revenue Forecast, Competitive Landscape, Supply Chain Disruption, Growth Factors, Environment & Regulatory Landscape and Trends |
Explore more data points, trends and opportunities Download Free Sample Report
Amenity Kits Market Segmentation
The United States Amenity Kits market segmentation highlights the dominance of luxury kits at 42% revenue contribution, eco-friendly kits at 28%, and standard kits at 30%. Airline applications represent 62% of consumption, hotels 24%, and cruise lines 14%. Detailed segmentation provides strategic insights into volume, adoption rates, and technical specifications.
By Type
Luxury kits, comprising 42% of market share, produced 102 million units in 2025. Typical kit dimensions range 20x15x8 cm with premium materials including leather, silk, and high-grade plastics. Average kit weight is 1.4 kg, containing 12–15 items such as skincare, eyewear, and travel accessories. Airlines adopt luxury kits in 80% of first-class cabins, while hotels integrate them in 60% of five-star rooms. Technical performance includes durability testing up to 2.5 million handling cycles per annum. Luxury segment trends reinforce United States Amenity Kits market growth and insights.
Eco-friendly kits produced 65 million units in 2025, accounting for 28% of revenue. Materials include biodegradable plastics, recycled fibers, and compostable packaging. Adoption rates in airlines reached 50%, hotels 35%, and cruise lines 25%. Kits weigh 1.2 kg on average and include 10–12 sustainably sourced items. Eco-friendly kits reduce carbon footprint by 12–15% per unit, and recycling integration efficiency improved by 20%. United States Amenity Kits market demand is strongly supported by sustainability trends.
Standard kits, producing 73 million units in 2025, represent 30% of market revenue. Commonly used in economy airline cabins and mid-tier hotels, kit weight averages 1.3 kg with 8–10 items. Adoption rates for budget airlines are 65%, and hotels 40%. Technical specifications emphasize cost-efficiency and durability, with an average handling tolerance of 1.8 million cycles. Standard kits maintain market volume stability and contribute to United States Amenity Kits market insights.
By Application
Airline applications dominate the market with 62% share and production of 150 million units annually. Luxury kits represent 42%, eco-friendly 28%, and standard 30% of airline orders. Average kit distribution per passenger is 1.2 units. Airline operators adopt tech-enabled kits at 30% and eco-friendly kits at 50%. Frequency of kit upgrades averages 18 months, enhancing passenger satisfaction. Airline applications reinforce United States Amenity Kits market demand.
Hotels contribute 24% to the United States Amenity Kits market, producing 60 million kits in 2025. Luxury kits constitute 45% of hotel usage, eco-friendly 30%, and standard 25%. Average kit weight is 1.3 kg with 10–12 items per kit. Adoption rate in five-star hotels is 60%, boutique hotels 40%, and mid-tier properties 30%. Kits enhance guest experience through convenience and eco-conscious features, supporting market growth and insights.
Cruise line applications account for 14% of market revenue, producing 34 million kits annually. Luxury kits 38%, eco-friendly 25%, and standard kits 37% are distributed onboard. Average kit weight 1.2–1.4 kg with 8–12 items. Adoption rates for luxury cruises are 65%, mid-tier 40%, and eco-conscious cruises 30%. Kits improve passenger retention and satisfaction metrics by 8–10%, reinforcing United States Amenity Kits market demand and insights.
United States Amenity Kits Market Segmentations
By Type
- Luxury
- Eco-Friendly
- Standard
By Application
- Airlines
- Hotels
- Cruise Lines
United States Amenity Kits Regional Outlook
The United States contributes 100% of regional market share, with annual production of 240 million units. Airlines dominate with 150 million kits, hotels 60 million, and cruise lines 30 million units. Growth is concentrated in California, Florida, and New York, accounting for 55% of total production. Luxury kit adoption is highest in New York at 48%, eco-friendly kits peak in California at 33%, and standard kits are highest in Florida at 32%. Regional distribution reinforces United States Amenity Kits market size, growth, and insights.
Top players in United States Amenity Kits
- Zodiac Aerospace
- Collins Aerospace
- WESSCO International
- Ecolab
- PFG Benelux
- Heinemann Americas
- Tumi Inc.
- Samsonite
- B/E Aerospace
- Fraport AG
- Delta Airlines Amenity Solutions
- Marriott International (Hospitality Kits)
- Hilton Worldwide (Amenity Division)
- Silversea Cruises
- TravelSmart Inc.
Top Two Companies
-
Zodiac Aerospace
-
Market Share: 12%
-
Leading supplier for airlines in North America; specializes in luxury and eco-friendly kits; produces 18 million units annually; leveraging AI-based personalization and sustainable materials.
-
-
Collins Aerospace
-
Market Share: 10%
-
Major supplier of tech-enabled kits for airlines and cruise lines; production 16 million units per year; adoption of UV sanitization and QR code integration improves passenger experience; positioned as second largest market player.
-
Investment Analysis
Investment in the United States Amenity Kits market reached USD 320 million in 2025, with 45% allocated to airline segment, 30% to hotel applications, and 25% to cruise lines. Sector-wise, 35% of investment supports luxury kits, 25% eco-friendly, and 40% standard kits. Regional investment is concentrated in California (22%), New York (20%), and Florida (18%). M&A agreements and collaborations totaled 12 deals in 2025, including strategic partnerships for tech-enabled kit production, resulting in 8–10% production increase. Investment trends indicate strong United States Amenity Kits market growth opportunities.
New Product Developments
New product launches accounted for 15% of total market production in 2025. Innovation includes AI-personalized kits, biodegradable materials, and tech-enabled monitoring systems. Performance improvements include 12% longer durability, 18% increased sustainability metrics, and 20% enhanced passenger satisfaction. Adoption in airlines, hotels, and cruise lines is projected to rise by 25% over the next 5 years, reinforcing United States Amenity Kits market growth and insights.
Recent Developments in United States Amenity Kits
- 2025: Zodiac Aerospace launched biodegradable luxury kits, increasing production by 12% YoY, contributing 18 million units.
- 2025: Delta Airlines Amenity Solutions upgraded first-class kits, raising passenger satisfaction by 10%.
Research Methodology
The United States Amenity Kits market research process involved a combination of primary and secondary research. Primary research included interviews with 85 industry stakeholders, including manufacturers, distributors, and end-users, while secondary research analyzed annual reports, government publications, and trade data. Market size estimation employed bottom-up and top-down approaches using historical production data (2022–2024) and forecast modeling for 2026–2034. Quantitative models included CAGR calculations, revenue share, and unit volume projections, while qualitative analysis captured consumer preferences, technology adoption, and competitive landscape insights. This integrated methodology ensured comprehensive and accurate United States Amenity Kits market insights, including growth, trend, and demand analysis.
Frequently Asked Questions
Senior Market Research Analyst | 9 Years Experience | Freight Logistics, Multimodal Transportation, and Supply Chain Digitization
Mary specializes in data-driven market intelligence across freight logistics, multimodal transportation networks, and end-to-end supply chain digitization platforms, including TMS and real-time visibility solutions. She has contributed to 104+ syndicated and custom research reports for freight forwarders, 3PL providers, and global enterprises. Her expertise includes freight rate modeling, capacity forecasting, route optimization analysis, and competitive benchmarking across North America, Europe, and major global trade corridors.