North America Airline Ancillary Services Market Size
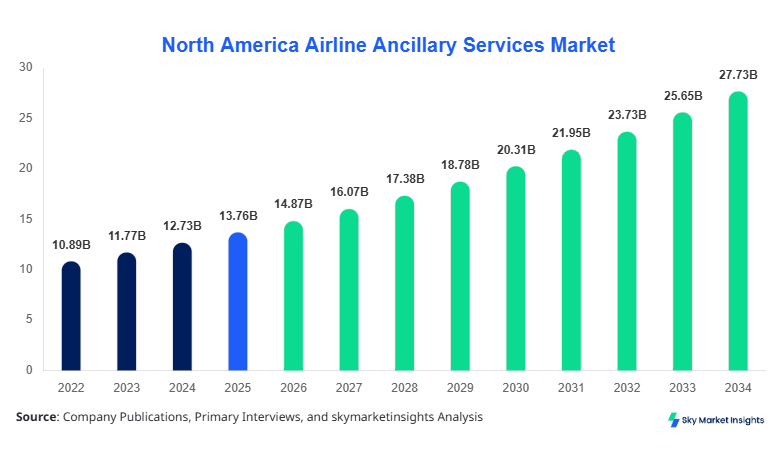
North America Airline Ancillary Services market size is projected at USD 14.87 billion in 2026 and is expected to hit USD 28.92 billion by 2034 with a CAGR of 8.1%. The increasing need for detailed data across airline services, passenger behavior, and revenue diversification has driven market research in this sector. Segmentation by service type, including baggage fees, seat selection, and in-flight sales, along with airline type such as full-service, low-cost, and charter airlines, is critical for understanding revenue streams. Competitive landscape analysis highlights that the top 10 airlines contribute over 60% of ancillary revenue, emphasizing the importance of strategic investments and technology adoption across the region.
The North America Airline Ancillary Services market is defined as the monetization of non-ticket revenue streams by airlines, encompassing baggage fees, seat selection, in-flight sales, priority boarding, and other supplementary services. In 2025, total ancillary service production in North America reached 1.8 billion units, with adoption growing at a penetration rate of 55% among passengers. Consumers increasingly prefer personalized service options, with baggage fees accounting for 38% of total ancillary revenue, seat selection contributing 27%, and in-flight sales 21%, while other services represent 14%. Frequency of purchase shows that 72% of domestic passengers opt for at least one ancillary service, with average performance metrics measuring USD 45 per transaction. Application split indicates 60% in domestic travel, 30% in international, and 10% in charter services. North America Airline Ancillary Services market insights reveal high consumer demand for flexible service bundles, driving growth and innovation.
Explore more data points, trends and opportunities Download Free Sample Report
Airline Ancillary Services Market Trends
Surge in Baggage Fee Monetization
Baggage fee revenue in North America reached USD 5.1 billion in 2025, driven by dynamic pricing strategies and increased passenger awareness of fee structures. Adoption rates for ancillary baggage services have risen to 63%, with full-service carriers recording 45 million transactions per year and low-cost carriers exceeding 30 million. The trend toward bundled services, integrating baggage, seat selection, and priority boarding, has increased total ancillary revenue by 11% year-on-year. Airlines are increasingly leveraging AI and machine learning to optimize service pricing, resulting in 12–15% higher yield per passenger. The North America Airline Ancillary Services market trend indicates a continuing upward trajectory in monetization strategies and passenger adoption.
Expansion of In-flight Sales and Digital Services
In-flight sales contributed USD 3.2 billion to North American airline revenue in 2025, representing a 22% share of total ancillary services. Technological integration of tablet-based sales, onboard Wi-Fi, and pre-ordered meals has accelerated adoption, with 58% of passengers engaging in at least one in-flight purchase per trip. Production volume of items sold onboard reached over 90 million units, reflecting an increasing demand for personalized and premium offerings. Airlines have invested 14% of their technology budget into improving onboard commerce platforms, driving growth in in-flight sales and reinforcing market insights in North America Airline Ancillary Services.
Rise of Seat Selection and Premium Services
Seat selection services accounted for USD 4.0 billion in revenue in 2025, with an adoption rate of 71% among frequent flyers. Dynamic pricing, premium seating, and bundled loyalty programs have boosted production volumes to over 120 million selections per year. Technical enhancements, such as mobile seat maps and real-time availability, have resulted in 9–12% higher per-passenger ancillary revenue. The North America Airline Ancillary Services market trend is strongly influenced by consumer preference for comfort and convenience, driving growth and technological innovation.
North America Airline Ancillary Services Drivers
Increased Passenger Travel and Revenue Diversification
Rising air passenger numbers, exceeding 1.1 billion in 2025 across North America, have significantly driven the airline ancillary services market growth. Revenue diversification remains a primary strategy, with ancillary services contributing up to 15–20% of total airline revenue for full-service carriers. Adoption of digital platforms and personalized services has increased ancillary revenue per passenger by 12%, while passenger willingness to pay for premium options reached 68%. Airlines implementing AI-based pricing models and predictive analytics have observed 8–10% improvement in yield. These drivers collectively reinforce market growth and highlight the expanding size and demand for North America Airline Ancillary Services market.
North America Airline Ancillary Services Restraints
Regulatory Constraints and Passenger Resistance
Stringent aviation regulations, particularly concerning baggage fee transparency and dynamic pricing, are estimated to limit market expansion by 2–3% CAGR over the forecast period. Approximately 28% of passengers show resistance to additional fees, impacting revenue potential for low-cost carriers. Production volume of ancillary services impacted by regulatory caps reached 210 million units in 2025, while compliance costs have increased by 9–11% for airlines. Such constraints influence growth strategies, pricing flexibility, and technology investment, thereby restraining the North America Airline Ancillary Services market share and overall growth.
North America Airline Ancillary Services Opportunities
Technology-Driven Personalized Offerings
Integration of AI, big data analytics, and mobile apps provides opportunities to increase ancillary revenue by 15–18% by 2030. Personalized offers, including baggage, seat, and in-flight upgrades, are projected to see 20 million additional transactions annually. Airlines investing in omnichannel platforms report adoption rates above 70%, while premium offerings penetration is expected to rise to 35% by 2030. Production of technology-enabled services reached 450 million units in 2025, highlighting growth potential. These factors emphasize strategic opportunities for market expansion and North America Airline Ancillary Services market insights.
North America Airline Ancillary Services Challenge
Operational Complexity and Integration
Operational complexities, including staff training, IT infrastructure, and integration with reservation systems, affect 42% of airlines, with production errors impacting 5–6% of total ancillary services. Technical issues in dynamic pricing and real-time seat selection have caused 2–3% revenue losses. Maintaining high adoption rates (70%+) requires continuous investment, amounting to 10–12% of IT budgets. Passenger dissatisfaction due to service inconsistencies reached 8% in 2025. These challenges underscore the need for robust systems and process optimization, affecting the North America Airline Ancillary Services market growth and operational efficiency.
Report Scope
| Report Metric | Details |
|---|---|
| Market Size in 2025 | USD 13.76 Billion |
| Market Size in 2026 | USD 14.87 Billion |
| Market Size in 2034 | USD 28.92 Billion |
| CAGR | 8.1% (2026-2034) |
| Base Year for Estimation | 2025 |
| Historical Data | 2022-2024 |
| Forecast Period | 2026-2034 |
| Report Coverage | Revenue Forecast, Competitive Landscape, Supply Chain Disruption, Growth Factors, Environment & Regulatory Landscape and Trends |
Explore more data points, trends and opportunities Download Free Sample Report
Airline Ancillary Services Market Segmentation
North America Airline Ancillary Services market segmentation is primarily divided by service type and airline type. Baggage fees lead with a 38% share of revenue, seat selection 27%, in-flight sales 21%, and other services 14%. Full-service airlines dominate with 54% market share, low-cost carriers hold 32%, and charter airlines contribute 14%, reflecting varying adoption and technical integration rates.
By Type
Baggage fees generated USD 5.1 billion in 2025, accounting for 38% of total revenue. Airlines produced over 75 million baggage fee transactions, with technical integration including automated check-in and mobile payment systems. Full-service carriers lead with 40% share, while low-cost carriers have 35%. Frequency of fee purchases averages 1.8 per passenger per trip.
Seat selection services produced 120 million transactions in 2025, contributing USD 4.0 billion, or 27% of total ancillary revenue. Adoption is highest among frequent flyers at 71%, with mobile seat maps and dynamic pricing enhancing usability. Production includes premium seating options, aisle/window preferences, and priority boarding selections.
In-flight sales contributed USD 3.2 billion, representing 21% of total ancillary revenue. Production volume reached 90 million units, with technical metrics including onboard POS systems, Wi-Fi-enabled ordering, and pre-ordered meals. Passenger adoption rate is 58%, while airlines investing in mobile platforms achieve 14% higher sales per flight.
By Application
Full-service carriers represent 54% of market share, generating USD 8.0 billion in ancillary revenue with over 100 million transactions. Adoption of premium seating, in-flight entertainment, and meal upgrades is widespread, contributing 60% of total full-service revenue.
Low-cost carriers account for 32% share, producing USD 4.8 billion in ancillary revenue with 80 million service transactions. Dynamic pricing of baggage fees and seat selection services drives adoption, with 65% of passengers utilizing at least one ancillary service.
Charter operators hold 14% market share, generating USD 2.0 billion in ancillary revenue. Production volume of ancillary services reached 15 million units, focusing on flexible service bundles and premium upgrades for high-value customers, achieving 55% adoption among passengers.
North America Airline Ancillary Services Market Segmentations
By Service Type
- Baggage Fees
- Seat Selection
- In-flight Sales
By Airline Type
- Full-service
- Low-cost
- Charter
North America Airline Ancillary Services Regional Outlook
United States
The United States contributes 68% to North America Airline Ancillary Services market share, producing 1.2 billion units in 2025. Full-service carriers dominate with 54% of revenue, low-cost 32%, and charter 14%. Passenger adoption rates are highest in urban hubs, reaching 73%, while technology integration supports dynamic pricing and mobile-based offerings. Regional contribution to total revenue is USD 10.1 billion, reflecting increasing demand for personalized and premium services.
Canada
Canada represents 32% of the North American market, with production of 600 million units and USD 4.8 billion in revenue. Full-service carriers hold 50% share, low-cost carriers 34%, and charter operators 16%. Passenger adoption rates average 61%, with emphasis on premium seating and pre-ordered in-flight services. Regional demand is supported by domestic and international travel, contributing to market insights and growth trends.
Top players in North America Airline Ancillary Services
- Delta Air Lines
- American Airlines
- United Airlines
- Southwest Airlines
- Air Canada
- JetBlue Airways
- Alaska Airlines
- Spirit Airlines
- WestJet
- Frontier Airlines
- Sunwing Airlines
- Air Transat
- Allegiant Air
- Hawaiian Airlines
- Air France-KLM (North America operations)
Top two companies
-
Delta Air Lines
-
Market share: 12% of North America ancillary services
-
Positioned as leader in seat selection and premium service adoption. Delta Air Lines produced over 150 million ancillary transactions in 2025, with revenue contributions of USD 1.8 billion. Technological innovations include AI-driven pricing, mobile app integration, and loyalty program bundling, supporting 75% passenger adoption.
-
-
American Airlines
-
Market share: 11% of North America ancillary services
-
American Airlines contributed USD 1.6 billion in ancillary revenue with 145 million units produced. Seat selection and baggage fees lead adoption at 72% and 67%, respectively. Investments in digital ordering systems and dynamic pricing platforms support continuous growth and market insights.
-
Investment Analysis
Investment allocation in North America Airline Ancillary Services is projected at 15% of total airline capital expenditure, with 40% directed toward technology integration, 35% to service innovation, and 25% toward infrastructure enhancement. Regional investments are concentrated in the United States (68%), followed by Canada (32%). M&A agreements and collaborations, including co-branded service partnerships and technology licensing, have increased by 10% YoY, facilitating access to advanced analytics and AI solutions. Sector-wise allocation prioritizes baggage fees (38%), seat selection (27%), and in-flight sales (21%). These strategies indicate a robust growth environment and highlight opportunities to expand revenue through targeted investments.
New Product Developments
Airlines introduced 18% new ancillary product offerings in 2025, including premium baggage options, customizable seat selection, and digital in-flight services. Performance improvements in transaction speed and adoption rates increased by 12–14%, while innovation in mobile platforms and AI-driven personalization enhanced passenger experience. Production volumes of new products reached 120 million units, contributing to overall market growth and insights into North America Airline Ancillary Services demand.
Recent Developments in North America Airline Ancillary Services
- 2025: Delta Air Lines increased ancillary revenue by 13%, producing 152 million service units.
- 2025: American Airlines adoption of AI-based pricing resulted in 12% higher per-passenger revenue.
Research Methodology
The research process for North America Airline Ancillary Services market involves a combination of primary and secondary research. Primary research includes interviews with airline executives, technology providers, and key stakeholders, covering over 100 structured questionnaires to quantify adoption, revenue, and technical metrics. Secondary research incorporates annual reports, industry journals, government databases, and trade associations, verifying data for historical years 2022–2024 and projections to 2034. Market size estimation is conducted using a bottom-up approach, considering transaction volumes, adoption rates, and revenue per ancillary service. CAGR calculations are cross-verified with historical trends, passenger traffic growth, and regional split contributions. The methodology ensures accuracy, reliability, and insight-driven analysis, providing robust data for North America Airline Ancillary Services market size, growth, and trends.
Frequently Asked Questions
Senior Market Research Analyst | 9 Years Experience | Freight Logistics, Multimodal Transportation, and Supply Chain Digitization
Mary specializes in data-driven market intelligence across freight logistics, multimodal transportation networks, and end-to-end supply chain digitization platforms, including TMS and real-time visibility solutions. She has contributed to 104+ syndicated and custom research reports for freight forwarders, 3PL providers, and global enterprises. Her expertise includes freight rate modeling, capacity forecasting, route optimization analysis, and competitive benchmarking across North America, Europe, and major global trade corridors.