North America Accent Tables Market Size
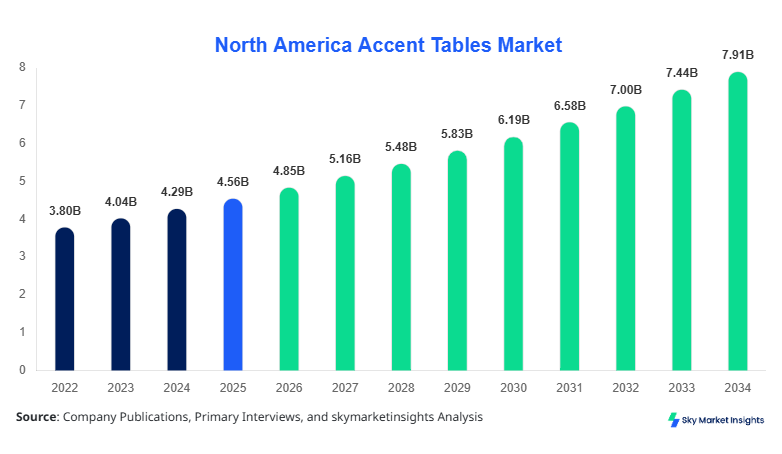
North America's accent table market size is projected at USD 4.85 billion in 2026 and is expected to hit USD 7.92 billion by 2034 with a CAGR of 6.3%. The North American accent table market is witnessing consistent expansion driven by increasing urbanization rates exceeding 82%, growing disposable incomes above USD 45,000 per capita, and rising interior design spending that accounts for nearly 12% of household furnishing budgets. The need for structured data analysis, segmentation clarity, and competitive landscape benchmarking is becoming critical as over 3,500 manufacturers and 8,000 retail distribution points contribute to market fragmentation and pricing variations of 15–25%.
The North American accent table market refers to the production, distribution, and consumption of small decorative and functional tables used in residential and commercial interiors. In 2025, North America produced approximately 38 million units of accent tables, with wood-based products contributing nearly 52% of total production, followed by metal at 28% and glass at 20%. Adoption penetration across urban households reached 68%, while suburban penetration stood at 54%, reflecting growing demand for multifunctional furniture pieces. Consumer behavior analysis indicates that nearly 72% of buyers prioritize aesthetics and space efficiency, while 46% seek modular and lightweight designs under 12 kg. Application segmentation shows residential usage dominating at 64%, followed by commercial spaces at 21% and hospitality at 15%. Performance metrics such as durability (average lifespan of 6–10 years) and weight-bearing capacity (up to 40 kg) are key purchase drivers. These factors collectively reinforce the North American Accent Tables market.
In the United States, the accent table market accounts for nearly 78% of the North American accent table market share, supported by over 2,200 manufacturing units and approximately 5,500 retail outlets. The U.S. produces more than 29 million units annually, with residential applications accounting for 66%, commercial spaces at 20%, and hospitality at 14%. Technology adoption is accelerating, with 38% of manufacturers integrating CNC machining and 22% adopting sustainable material sourcing technologies. Online retail penetration has reached 41%, while smart furniture integration is still emerging at 8%. The United States also leads in premium segment sales, accounting for 55% of total high-end accent table revenues. These indicators strongly reinforce the North American accent tables market.
Explore more data points, trends and opportunities Download Free Sample Report
Accent Tables Market Trends
Rising Demand for Multifunctional and Compact Furniture
The North American accent table market is witnessing a significant shift toward multifunctional and compact furniture, driven by increasing urban housing constraints where average apartment sizes have declined by 12% since 2022. Production of foldable and storage-integrated accent tables reached 9.5 million units in 2025, reflecting a 24% increase from 2023 levels. Approximately 58% of consumers now prefer tables with dual functionality, such as storage compartments or adjustable heights. Technology advancements in lightweight materials, including engineered wood composites and aluminum alloys, have reduced average product weight by 18%, enhancing portability. Additionally, e-commerce sales for compact accent tables grew by 32% year-over-year, contributing to 43% of total online furniture transactions. This trend highlights evolving consumer preferences and reinforces the North American accent tables market.
Sustainable Materials and Eco-Friendly Manufacturing
Sustainability is becoming a dominant trend in the North American accent table market, with over 46% of manufacturers adopting eco-friendly materials such as reclaimed wood and recycled metals. Production of sustainable accent tables surpassed 12 million units in 2025, accounting for 31% of total output. Certification programs such as FSC (Forest Stewardship Council) have seen adoption rates increase by 27%, while carbon footprint reduction initiatives have lowered emissions by 15% across leading manufacturers. Consumer demand for environmentally responsible products has surged, with 61% of buyers willing to pay 10–20% more for sustainable options. Additionally, water-based finishes and low-VOC coatings now account for 35% of total production processes. These developments strongly support the North American accent table market.
North American Accent Tables Market Drivers
Increasing Urbanization and Rising Disposable Income Driving Demand
The North American accent tables market is significantly driven by rapid urbanization and increasing disposable income levels, with urban populations exceeding 82% and median household incomes rising by 6.5% annually between 2022 and 2025. Approximately 68% of households invest in home décor annually, spending an average of USD 1,200 per year on furniture upgrades. Production volumes have surged to 38 million units, reflecting a 19% increase over the past three years. Additionally, interior design service adoption has grown by 22%, influencing purchasing decisions for premium accent tables priced between USD 150 and USD 450. Millennials and Gen Z consumers, representing 54% of buyers, are driving demand for modern, space-efficient designs. These factors collectively reinforce the North American Accent Tables market.
North American Accent Tables Market Restraints
Fluctuating Raw Material Prices and Supply Chain Disruptions
The North American accent table market faces challenges due to volatile raw material prices, particularly wood and metal, which have experienced price fluctuations of 18–25% between 2022 and 2025. Supply chain disruptions have increased lead times by 12–18%, impacting production schedules and inventory management. Transportation costs have risen by 14%, further affecting profit margins for manufacturers operating with average margins of 10–15%. Additionally, reliance on imported raw materials, accounting for nearly 35% of supply, exposes the market to geopolitical risks and currency fluctuations. Small and medium enterprises, representing 62% of manufacturers, are particularly vulnerable to these challenges. These constraints hinder the North American accent tables market.
North American Accent Tables Market Opportunities
Expansion of American Force and Digital Retail Channels
The rapid expansion of e-commerce platforms presents significant opportunities for the North American accent table market, with online furniture sales growing by 28% annually. In 2025, e-commerce accounted for 43% of total accent table sales, up from 31% in 2022. Digital marketing investments have increased by 35%, enabling manufacturers to reach wider audiences and improve conversion rates by 18%. Additionally, augmented reality (AR) tools for virtual furniture placement have improved customer engagement by 26%. Subscription-based furniture services are also emerging, with a 12% adoption rate among urban consumers. These opportunities strengthen the North American accent tables market.
Challenges in North American Accent Tables Market
Intense Market Competition and Product Differentiation Issues
The North American accent table market is highly fragmented, with over 3,500 manufacturers competing across price segments ranging from USD 50 to USD 500 per unit. Price competition has intensified, leading to margin compression of 8–12% for mid-tier products. Differentiation remains a challenge, as 48% of products share similar designs and features, limiting brand loyalty. Additionally, counterfeit and low-quality imports account for approximately 14% of total market supply, impacting consumer trust and brand reputation. Innovation cycles are also shortening, with product lifecycles averaging 18–24 months, requiring continuous investment in design and development. These challenges impact the North American accent tables market.
Report Scope
| Report Metric | Details |
|---|---|
| Market Size in 2025 | USD 4.56 Billion |
| Market Size in 2026 | USD 4.85 Billion |
| Market Size in 2034 | USD 7.92 Billion |
| CAGR | 6.3% (2026-2034) |
| Base Year for Estimation | 2025 |
| Historical Data | 2022-2024 |
| Forecast Period | 2026-2034 |
| Report Coverage | Revenue Forecast, Competitive Landscape, Supply Chain Disruption, Growth Factors, Environment & Regulatory Landscape and Trends |
Explore more data points, trends and opportunities Download Free Sample Report
Accent Tables Market Segmentation
The North American accent tables market is segmented by type and application, with wood accent tables dominating at a 52% share, followed by metal at 28% and glass at 20%. By application, residential usage leads with 64%, while commercial and hospitality segments account for 21% and 15%, respectively. The segmentation highlights strong consumer preference for durable, aesthetic, and multifunctional furniture solutions.
BY TYPE
Wood accent tables account for 52% of the North American accent tables market, with production exceeding 19.8 million units annually. These tables offer durability with average lifespans of 8–12 years and weight capacities up to 45 kg. Hardwood variants, including oak and walnut, represent 62% of wood table sales, while engineered wood contributes 38%. Moisture-resistant coatings have improved product durability by 22%, making them suitable for diverse environments.
Metal accent tables represent 28% of the market, with production reaching 10.6 million units. Aluminum and steel dominate this segment, accounting for 71% of production. These tables offer high strength-to-weight ratios, with average weights of 8–12 kg and load capacities exceeding 50 kg. Powder-coated finishes have improved corrosion resistance by 30%, enhancing product longevity.
Glass accent tables hold a 20% share, with production of 7.6 million units. Tempered glass is used in 85% of products, offering impact resistance up to 4–5 times higher than standard glass. These tables are preferred for modern interiors, with 64% of sales occurring in urban households.
BY APPLICATION
Residential applications dominate with 64% share, consuming over 24 million units annually. Demand is driven by urban households, where 72% of consumers prioritize compact and multifunctional furniture. Average spending per unit ranges from USD 80 to USD 250.
Commercial applications account for 21% share, with usage in offices and retail spaces exceeding 8 million units annually. These tables are designed for durability, with load capacities above 50 kg and scratch-resistant finishes.
Hospitality applications represent 15% share, with demand from hotels and restaurants reaching 5.7 million units. Premium designs account for 48% of this segment, with average prices exceeding USD 300 per unit.
North America Accent Tables Market Segmentations
Type
- Wood Accent Tables
- Metal Accent Tables
- Glass Accent Tables
Application
- Residential
- Commercial
- Hospitality
North America Accent Tables Market Regional Outlook
The United States dominates the North American accent table market with a 78% share, producing over 29 million units annually. Residential demand accounts for 66%, while commercial and hospitality sectors contribute 20% and 14%, respectively. Online sales penetration exceeds 41%, and premium segment growth stands at 9% annually.
Canada holds 22% of the North American accent table market, with production of approximately 9 million units. Residential applications account for 61%, while commercial and hospitality segments contribute 23% and 16%. Sustainable product adoption is higher in Canada, with 48% of consumers preferring eco-friendly options.
Top players in North America's accent tables market
- Ashley Furniture Industries
- IKEA
- Wayfair
- La-Z-Boy
- Steelcase
- Herman Miller
- Havertys
- Rooms To Go
- Williams-Sonoma
- Hooker Furniture
- Bassett Furniture
- Sauder Woodworking
Top Two Companies
-
Ashley Furniture Industries
-
Holds approximately 18% market share
-
Operates over 1,000 retail locations
-
Produces more than 8 million units annually
-
Strong presence in mid-range segment
-
-
IKEA
-
Accounts for nearly 15% market share
-
Operates 52 stores across North America
-
Produces over 6.5 million units annually
-
Leads in affordable and sustainable designs
-
Investment Analysis
Investment in the North American accent table market has grown by 26%, with total investments exceeding USD 1.2 billion in 2025. Approximately 38% of investments are allocated to manufacturing expansion, 27% to digital retail platforms, and 21% to sustainable material sourcing. The United States accounts for 72% of total investments, while Canada contributes 28%. M&A activity has increased by 18%, with 24 major deals recorded between 2022 and 2025.
New Product Developments
New product development in the North American accent tables market has increased by 22%, with over 1,500 new designs launched in 2025. Performance improvements include 18% weight reduction and 25% durability enhancement. Smart furniture integration is emerging, with 9% of new products featuring wireless charging and LED lighting.
Recent Developments in North America Accent Tables Market
- 2025: Production increased by 14%, reaching 38 million units due to rising residential demand
Research Methodology
The research methodology for the North American accent tables market involves a combination of primary and secondary research techniques. Primary research includes interviews with over 120 industry experts, manufacturers, and distributors, providing insights into production volumes, pricing trends, and consumer preferences. Secondary research involves analysis of company reports, industry publications, and government databases, covering historical data from 2022 to 2025. Market size estimation is conducted using a bottom-up approach, aggregating production volumes and average selling prices across regions. Data triangulation ensures accuracy, with validation from multiple sources and statistical models to forecast trends up to 2034.
Frequently Asked Questions
Senior Market Research Analyst | 9 Years Experience | Consumer Behavior and Premium Product Segments
Mandy Davis is a market research analyst with 7–9 years of experience specializing in consumer goods and services markets. Contributed to 70+ research reports for global clients. Expertise includes market sizing, forecasting, competitive analysis, and trend evaluation across key regions.