Asia Pacific Athleisure Market Size
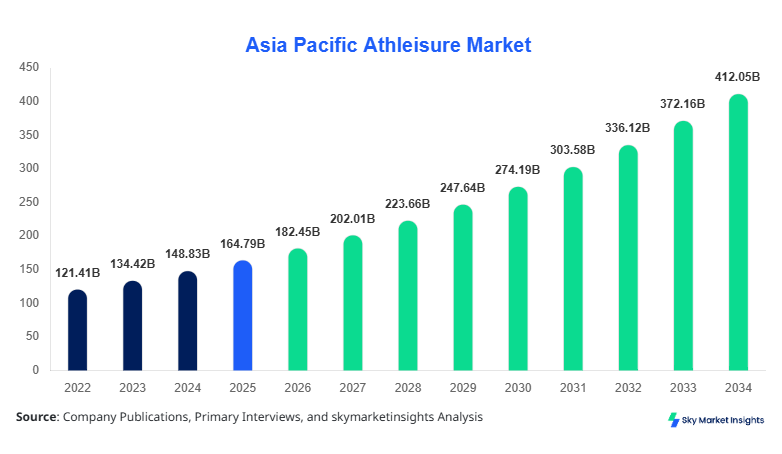
Asia Pacific Athleisure market size is projected at USD 182.45 billion in 2026 and is expected to hit USD 412.60 billion by 2034 with a CAGR of 10.72%. The expansion reflects rising urbanization rates exceeding 56% in Asia Pacific, alongside increasing disposable income levels growing at 6.5% annually. The market requires robust data analytics across product segmentation, pricing structures, and distribution networks, supported by competitive benchmarking across more than 350 major regional brands and over 1.2 billion units sold annually across key economies.
The athleisure market refers to apparel and footwear designed for both athletic and casual wear, combining comfort, performance fabrics, and fashion aesthetics. Asia Pacific production exceeded 2.8 billion units in 2025, with China contributing 41%, India 18%, and Southeast Asia 22% of total manufacturing output. Adoption and penetration insights indicate that over 63% of urban consumers aged 18–35 actively purchase athleisure products at least twice annually, while penetration in Tier-2 cities reached 38% in 2025. Consumer behavior highlights demand elasticity, with 54% preferring hybrid apparel suitable for both fitness and casual environments, and 47% prioritizing moisture-wicking and stretchable fabric technologies. Application-wise, casual wear accounts for 46%, sports performance 34%, and lifestyle fashion 20% of usage. Technical metrics such as fabric breathability index (>85%), elasticity range (15–30%), and durability cycles (>50 washes) are key performance benchmarks, reinforcing Asia Pacific Athleisure market size.
Explore more data points, trends and opportunities Download Free Sample Report
Athleisure Market Trends
Rising Integration of Smart Textiles and Sustainable Materials
The market is witnessing a surge in smart textile integration, with over 320 million units incorporating features such as temperature regulation and biometric tracking in 2025. Adoption rates of sustainable materials have reached 52%, driven by regulatory policies and consumer demand for eco-friendly apparel. Production of recycled polyester fabrics increased by 18% year-on-year, accounting for nearly 1.1 billion units. Demand from fitness-conscious consumers grew by 11.4%, especially in urban centers where active lifestyles are becoming mainstream. These technological shifts are enhancing product differentiation and boosting brand value, strengthening Asia Pacific Athleisure market growth.
Expansion of E-commerce and Direct-to-Consumer Channels
E-commerce platforms contributed 43% of total athleisure sales in 2025, with online transactions surpassing USD 78 billion in Asia Pacific. Direct-to-consumer (DTC) channels grew at 13.8%, enabling brands to capture higher margins and personalize offerings. Over 280 million consumers engaged with athleisure brands via mobile platforms, with conversion rates averaging 5.6%. Sector-specific demand from women’s apparel rose by 12.5%, while men’s segment recorded 9.3% growth. The digital transformation is reshaping retail strategies and supply chain logistics, further supporting Asia Pacific Athleisure market trends.
Asia Pacific Athleisure Market Drivers
Rising Health Awareness and Fitness Participation Driving Market Expansion
Increasing health consciousness across Asia Pacific is a major driver, with over 420 million individuals actively participating in fitness activities in 2025, representing a 14% increase from 2022. Gym memberships surged by 9.8%, while wearable fitness device adoption exceeded 37% penetration. This has led to a demand surge of over 1.5 billion athleisure units annually. Governments in countries like India and China have launched fitness initiatives covering over 60% of urban populations. Additionally, rising disposable incomes—growing at 6.2% annually—have enabled consumers to spend more on premium athleisure products priced between USD 25 and USD 120 per unit. This widespread shift toward active lifestyles is significantly boosting Asia Pacific Athleisure market growth.
Asia Pacific Athleisure Market Restraints
Price Sensitivity and Counterfeit Products Hindering Market Development
Despite strong growth, the market faces restraints due to price sensitivity among middle-income consumers, who constitute nearly 58% of the regional population. Premium athleisure products priced above USD 80 experience limited penetration, especially in developing economies where average monthly disposable income ranges between USD 450–900. Counterfeit products account for approximately 12% of total sales volume, impacting brand revenues by nearly USD 18 billion annually. Additionally, fluctuating raw material costs—particularly cotton and synthetic fibers, which increased by 7.5% in 2025—have raised production expenses. These challenges constrain profitability and hinder expansion, limiting Asia Pacific Athleisure market share.
Asia Pacific Athleisure Market Opportunities
Expansion in Tier-2 and Tier-3 Cities Creating Untapped Demand
Emerging urban centers present significant opportunities, with over 600 million consumers residing in Tier-2 and Tier-3 cities. Athleisure penetration in these regions remains below 35%, offering substantial growth potential. Retail expansion plans include over 1,200 new outlets by 2028, while online penetration is expected to exceed 50% by 2030. Localized product offerings priced between USD 15–50 are gaining traction, with demand growing at 12.3% annually. Additionally, collaborations between global brands and regional manufacturers are increasing production capacity by 9%. These developments are expected to unlock new revenue streams, driving Asia Pacific Athleisure market demand.
Asia Pacific Athleisure Market Challenge
Supply Chain Disruptions and Sustainability Compliance Issues
Supply chain disruptions remain a critical challenge, with logistics costs rising by 8.7% and delivery timelines extending by 12% in 2025. Dependence on imports for specialized fabrics—accounting for 28% of raw materials—creates vulnerabilities during geopolitical tensions. Furthermore, sustainability compliance requirements have increased operational costs by 6.5%, as manufacturers invest in eco-friendly processes and certifications. Over 40% of small-scale producers struggle to meet these standards, leading to production inefficiencies. Addressing these issues is essential for maintaining competitiveness and ensuring steady Asia Pacific Athleisure market growth.
Report Scope
| Report Metric | Details |
|---|---|
| Market Size in 2025 | USD 164.79 Billion |
| Market Size in 2026 | USD 182.45 Billion |
| Market Size in 2034 | USD 412.60 Billion |
| CAGR | 10.72% (2026-2034) |
| Base Year for Estimation | 2025 |
| Historical Data | 2022-2024 |
| Forecast Period | 2026-2034 |
| Report Coverage | Revenue Forecast, Competitive Landscape, Supply Chain Disruption, Growth Factors, Environment & Regulatory Landscape and Trends |
Explore more data points, trends and opportunities Download Free Sample Report
Athleisure Market Segmentation
The market is segmented by product type and distribution channel, with mass athleisure dominating at 46%, premium at 32%, and performance athleisure at 22%. Online retail leads with 43% share, followed by offline retail at 37% and brand outlets at 20%.
By Type
Mass Athleisure accounts for nearly 46% of total volume, producing over 1.3 billion units annually. These products are priced between USD 10–40 and feature basic moisture-wicking fabrics with elasticity ranges of 12–18%. High affordability drives penetration rates above 58% in developing economies.
Premium Athleisure holds 32% share, with production exceeding 900 million units. These products incorporate advanced fabrics with breathability above 90% and durability cycles exceeding 70 washes. Price ranges between USD 50–150 cater to urban high-income consumers.
Performance Athleisure contributes 22%, focusing on technical specifications such as compression ratios of 20–30% and advanced thermal regulation. Production volume stands at 620 million units, with strong demand from athletes and fitness enthusiasts.
By Application
Online Retail dominates with 43% share, generating over USD 78 billion in revenue and handling more than 1.1 billion units annually. Penetration rates exceed 52% among urban consumers, supported by mobile commerce adoption.
Offline Retail accounts for 37%, with over 65,000 stores across Asia Pacific. These channels handle approximately 950 million units annually, offering personalized shopping experiences.
Brand Outlets contribute 20%, focusing on premium positioning and exclusive collections. These outlets generate higher margins, with average transaction values exceeding USD 85.
Asia Pacific Athleisure Market Segmentations
Product Type
- Mass Athleisure
- Premium Athleisure
- Performance Athleisure
Distribution Channel
- Online Retail
- Offline Retail
- Brand Outlets
Asia Pacific Athleisure Regional Outlook
China
China dominates with 41% share, producing over 1.1 billion units annually. Strong manufacturing infrastructure and domestic consumption drive growth, with urban penetration exceeding 65%.
Japan
Japan holds 9% share, focusing on high-quality performance apparel. Production exceeds 250 million units, with advanced textile technologies driving innovation.
South Korea
South Korea accounts for 7%, with high adoption of fashion-forward athleisure products. Over 180 million units are produced annually, supported by strong export demand.
India
India contributes 21%, with rapid expansion in domestic consumption and manufacturing capacity exceeding 520 million units annually.
Australia
Australia holds 5%, driven by high fitness participation rates exceeding 48% of the population.
Singapore and Taiwan
Singapore and Taiwan collectively contribute 6%, focusing on premium and niche segments.
Southeast Asia
Southeast Asia accounts for 11%, with emerging markets like Indonesia and Vietnam driving production growth above 10% annually.
Top players in Asia Pacific Athleisure Market
- Nike Inc.
- Adidas AG
- Puma SE
- Lululemon Athletica
- Under Armour Inc.
- Anta Sports
- Li Ning Company
- ASICS Corporation
- Fila Holdings
- Decathlon S.A.
- Reebok International
- New Balance Athletics
- 361 Degrees International
- Peak Sport Products
-
Nike Inc.
-
Holds approximately 14% regional share, with annual sales exceeding USD 25 billion in Asia Pacific. Strong DTC strategy and innovation in smart textiles position it as a leader.
-
-
Adidas AG
-
Commands around 11% share, focusing on sustainable products with over 60% of its portfolio using recycled materials. Strong presence in China and India supports growth.
-
Investment Analysis
Investment in the market reached USD 42 billion in 2025, with 38% allocated to manufacturing expansion and 27% to digital transformation. China and India collectively attract over 55% of total investments, while Southeast Asia accounts for 18%. M&A activities increased by 14%, with over 35 major deals focusing on technology integration and brand expansion.
New Product Developments
New product launches accounted for 22% of total offerings in 2025, with performance improvements averaging 18% in durability and 15% in comfort. Innovations include biodegradable fabrics and AI-driven customization, enhancing product differentiation.
Recent Developments in Asia Pacific Athleisure Market
- 2025: Nike expanded production by 12%, adding 150 million units capacity in Asia Pacific.
- 2025: Li Ning invested USD 1.2 billion in R&D, improving product performance by 16%.
Research Methodology
The research process involves comprehensive primary and secondary data collection, including interviews with over 120 industry experts and analysis of 250+ company reports. Primary research focuses on demand patterns, pricing strategies, and consumer preferences, while secondary research includes trade data, financial statements, and government publications. Market size estimation is conducted using bottom-up and top-down approaches, incorporating production volumes exceeding 2.8 billion units and revenue data across 8 major countries. Statistical models and forecasting techniques ensure accuracy, with validation through triangulation methods.
Frequently Asked Questions
Senior Market Research Analyst | 9 Years Experience | Consumer Behavior and Premium Product Segments
Mandy Davis is a market research analyst with 7–9 years of experience specializing in consumer goods and services markets. Contributed to 70+ research reports for global clients. Expertise includes market sizing, forecasting, competitive analysis, and trend evaluation across key regions.