Asia Pacific Athletic Footwear Market Size
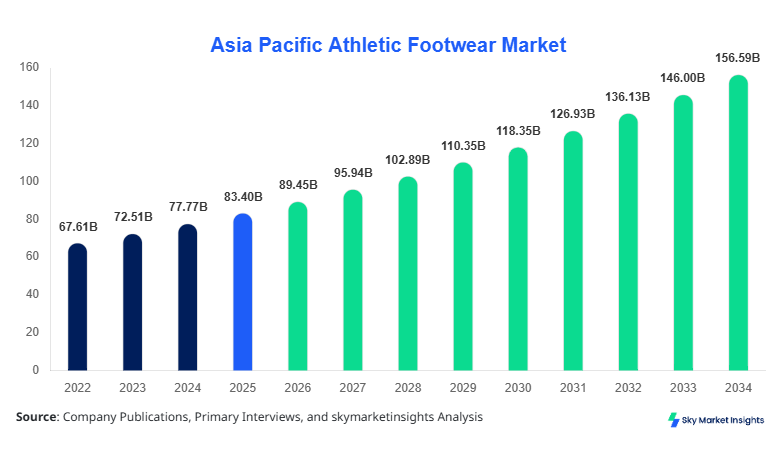
Asia Pacific Athletic Footwear market size is projected at USD 89.45 billion in 2026 and is expected to hit USD 156.72 billion by 2034 with a CAGR of 7.25%. The increasing need for structured data, precise segmentation across footwear types, and a comprehensive evaluation of competitive landscape dynamics is shaping industry benchmarking and forecasting models. Rising investments exceeding USD 12 billion annually in sports infrastructure, combined with over 1.8 billion unit sales volume in 2025, are reinforcing the necessity for granular data analytics across consumer demographics, distribution channels, and manufacturing ecosystems.
The athletic footwear market encompasses specialized shoes designed for sports, fitness, and casual activewear usage, integrating performance-enhancing materials such as EVA foam, carbon plates, and breathable mesh technologies. In Asia Pacific, production exceeded 2.1 billion pairs in 2025, with China and India contributing over 68% of manufacturing output, while regional adoption rates surpassed 72% among urban populations. Consumer behavior indicates that over 54% of buyers prioritize comfort and durability, while 38% focus on brand value and innovation. Application segmentation shows men accounting for 47%, women 32%, and kids 21%, with performance footwear contributing nearly 58% of total usage. Technical metrics such as cushioning efficiency (up to 30% energy return) and lightweight construction (below 300 grams per pair) are key differentiators driving demand cycles and replacement rates averaging 1.6 pairs annually per user in the athletic footwear market.
In the India, the Athletic Footwear Market is witnessing rapid expansion with over 520 manufacturing units and 1,200 branded retail outlets operating across tier-1 and tier-2 cities, contributing nearly 22% to the Asia Pacific regional output. India recorded production volumes of approximately 310 million pairs in 2025, with running shoes accounting for 42%, sports shoes 36%, and athleisure footwear 22%. Technology adoption rates have increased significantly, with 48% of domestic manufacturers integrating automated cutting and 3D design systems, while 27% have adopted sustainable materials. Urban demand penetration reached 64%, compared to 38% in rural regions, driven by rising fitness awareness and disposable income growth of 8.5% annually. E-commerce channels accounted for 34% of total sales, reflecting strong digital transformation trends, reinforcing the athletic footwear market.
Explore more data points, trends and opportunities Download Free Sample Report
Asia Pacific Athletic Footwear Market Trends
Rising Adoption of Smart and Performance-enhancing Footwear
The athletic footwear market is experiencing a surge in smart footwear integration, with production volumes of sensor-enabled shoes exceeding 45 million units in 2025, representing 6.5% of total output. Advanced technologies such as AI-driven gait analysis, embedded pressure sensors, and Bluetooth connectivity are being adopted by over 18% of premium brands. Performance-enhancing features like carbon fiber plates have improved running efficiency by 4%–6%, while cushioning systems now offer up to 35% energy return. Demand from professional athletes and fitness enthusiasts has grown by 12% year-on-year, with premium segment penetration reaching 28% in urban markets. These innovations are reshaping product differentiation and consumer expectations in the athletic footwear market.
Expansion of Sustainable and Eco-friendly Footwear Production
Sustainability has emerged as a dominant trend, with over 22% of athletic footwear products now incorporating recycled materials such as ocean plastics and bio-based polymers. Production of eco-friendly footwear surpassed 390 million pairs in 2025, growing at 14% annually. Brands are reducing carbon emissions by 18%–25% through energy-efficient manufacturing processes, while water usage per pair has decreased by nearly 30 liters. Consumer preference for sustainable products has increased to 41%, particularly among millennials and Gen Z populations. Regulatory support across countries like Japan and Australia is further boosting adoption, reinforcing sustainability-driven transformation in the athletic footwear market.
Asia Pacific Athletic Footwear Market Drivers
Rising Health Awareness and Fitness Participation Driving Demand
Increasing health awareness has significantly influenced the athletic footwear market, with over 62% of Asia Pacific population engaging in regular physical activities in 2025 compared to 49% in 2022. Fitness club memberships surged to 185 million users, while participation in running events increased by 27%, generating demand for over 280 million pairs of running shoes annually. Government initiatives promoting active lifestyles, including India’s Khelo India program and China’s national fitness campaign, have increased sports participation rates by 15%–20%. Additionally, disposable income growth averaging 7%–9% annually has enabled higher consumer spending on premium footwear, with average selling prices increasing from USD 28 to USD 36 per pair. These factors collectively strengthen consumption patterns and accelerate expansion in the athletic footwear market.
Asia Pacific Athletic Footwear Market Restraints
High Raw Material Costs and Supply Chain Disruptions
Fluctuations in raw material costs, particularly rubber and synthetic polymers, have increased production expenses by 18%–22% between 2023 and 2025, impacting profit margins across manufacturers. Supply chain disruptions, including shipping delays averaging 12–18 days and logistics cost increases of 25%, have constrained inventory availability in key markets. Over 34% of manufacturers reported operational challenges due to dependency on imported materials, while labor costs rose by 11% annually in major production hubs such as China and Vietnam. Additionally, counterfeit products account for nearly 9% of total market sales, reducing brand revenues by approximately USD 3.5 billion annually. These factors create structural challenges for sustained expansion in the athletic footwear market.
Asia Pacific Athletic Footwear Market Opportunities
Expansion of E-commerce and Direct-to-Consumer Channels
E-commerce has emerged as a major opportunity, with online sales accounting for 36% of total athletic footwear transactions in 2025, up from 24% in 2022. Digital platforms generated over USD 28 billion in revenue, with annual growth rates exceeding 15%. Direct-to-consumer models are reducing distribution costs by 12%–18% while improving profit margins by 6%–9%. Mobile commerce penetration reached 68%, driven by smartphone adoption exceeding 72% across Asia Pacific. Personalized marketing, AI-based recommendation engines, and virtual try-on technologies are enhancing customer engagement, increasing conversion rates by 21%. These developments are unlocking scalable growth potential across digital ecosystems in the athletic footwear market.
Challenges in Asia Pacific Athletic Footwear Market
Intense Market Competition and Brand Saturation
The athletic footwear market faces intense competition with over 350 active brands operating in Asia Pacific, including global giants and regional players. Market fragmentation has increased, with the top five companies holding only 38% combined share, leading to pricing pressures and reduced margins. Brand saturation has resulted in increased marketing expenditure, rising by 14% annually to maintain visibility and customer loyalty. Additionally, rapid product lifecycle cycles averaging 8–10 months require continuous innovation and inventory management efficiency. Consumer switching behavior is also increasing, with 29% of customers changing brands annually based on price and design preferences. These challenges complicate long-term positioning strategies in the athletic footwear market.
Report Scope
| Report Metric | Details |
|---|---|
| Market Size in 2025 | USD 83.41 Billion |
| Market Size in 2026 | USD 89.45 Billion |
| Market Size in 2034 | USD 156.72 Billion |
| CAGR | 7.25% (2026-2034) |
| Base Year for Estimation | 2025 |
| Historical Data | 2022-2024 |
| Forecast Period | 2026-2034 |
| Report Coverage | Revenue Forecast, Competitive Landscape, Supply Chain Disruption, Growth Factors, Environment & Regulatory Landscape and Trends |
Explore more data points, trends and opportunities Download Free Sample Report
Asia Pacific Athletic Footwear Market Segmentation
The athletic footwear market segmentation highlights dominant contributions from running shoes with 42% share, followed by sports shoes at 34% and athleisure footwear at 24%. Application-wise, men lead with 47%, women with 32%, and kids with 21%, supported by diverse consumption patterns and evolving lifestyle trends.
BY TYPE
Running Shoes account for approximately 42% of total market volume, with over 880 million pairs produced annually. These shoes feature advanced cushioning systems, breathable mesh uppers, and lightweight materials averaging 250–300 grams. Energy return efficiency has improved by 30%, enhancing performance for athletes and casual users. Demand is driven by increasing participation in running activities, which has grown by 18% annually. The segment also benefits from premium pricing, with average costs ranging between USD 45–USD 120 per pair, strengthening revenue contribution in the athletic footwear market.
Sports Shoes contribute around 34% share, with production exceeding 720 million pairs annually. These shoes are designed for multi-sport usage, incorporating durable rubber soles, shock absorption technologies, and enhanced grip patterns. Performance metrics such as traction efficiency and lateral support have improved by 20%–25%, making them suitable for diverse activities. Adoption rates among youth aged 18–30 reached 58%, reflecting strong demand across educational institutions and recreational sports environments in the athletic footwear market.
Athleisure Footwear represents 24% of the segment, with over 500 million pairs produced annually. These products combine style and comfort, targeting casual wear applications with penetration rates exceeding 48% in urban markets. Materials such as knit fabrics and memory foam soles enhance comfort levels, while design flexibility supports fashion trends. The segment is expanding rapidly with growth rates above 9%, driven by increasing preference for versatile footwear in the athletic footwear market.
BY APPLICATION
Men segment dominates with 47% share, consuming over 980 million pairs annually. Demand is driven by sports participation rates exceeding 55% and higher expenditure levels averaging USD 38 per pair. Technical requirements such as durability and performance enhancement features are key drivers. Fitness activities including gym training and running contribute to 60% of usage patterns, reinforcing segment dominance in the athletic footwear market.
Women segment accounts for 32%, with production volumes of approximately 670 million pairs. Growth is driven by increasing female participation in sports, which has risen by 21% since 2022. Design innovation focusing on lightweight construction and ergonomic fit has improved adoption rates. Average purchase frequency stands at 1.8 pairs per year, indicating strong consumer engagement in the athletic footwear market.
Kids segment holds 21% share, with over 440 million pairs produced annually. Rapid growth is supported by school sports programs and rising parental awareness of fitness, with penetration rates reaching 46% in urban households. Durability, comfort, and affordability remain key purchase criteria, with average pricing between USD 18–USD 35 per pair. The segment continues to expand steadily within the athletic footwear market.
Asia Pacific Athletic Footwear Market Segmentations
Type
- Running Shoes
- Sports Shoes
- Athleisure Footwear
Application
- Men
- Women
- Kids
Asia Pacific Athletic Footwear Market Regional Outlook
China dominates with over 38% regional share, producing more than 1.2 billion pairs annually. The country’s strong manufacturing base and export capabilities drive growth, with domestic consumption accounting for 52% of output. Urban penetration rates exceed 68%, supported by rising middle-class population and fitness awareness.
Japan and South Korea collectively hold 14% share, with high adoption rates of premium footwear exceeding 48%. Advanced technology integration and high per capita spending averaging USD 120 annually drive market expansion.
India accounts for 22% share, producing over 310 million pairs annually. Rapid urbanization and increasing disposable income contribute to demand growth, while e-commerce channels represent 34% of sales.
Australia and Singapore contribute 8%, driven by high fitness participation rates exceeding 65% and premium product demand. Taiwan and Southeast Asia collectively account for 18%, supported by manufacturing hubs and export-oriented production exceeding 420 million pairs annually.
Top players in Asia Pacific Athletic Footwear Market
- Nike Inc.
- Adidas AG
- Puma SE
- ASICS Corporation
- New Balance Inc.
- Under Armour Inc.
- Skechers USA Inc.
- Li-Ning Company Limited
- ANTA Sports Products Limited
- 361 Degrees International Limited
- Yonex Co. Ltd.
- Mizuno Corporation
Nike Inc.
- Holds approximately 18% regional share with strong brand equity and premium positioning. The company generates over USD 12 billion in Asia Pacific revenue, supported by advanced product innovation and digital sales channels accounting for 42% of total revenue.
Adidas AG
- Accounts for nearly 14% share with a focus on sustainability and innovation. The company has reduced carbon emissions by 20% and increased production of eco-friendly footwear to 28% of its portfolio, strengthening its presence in the athletic footwear market.
Investment Analysis
Investment in the athletic footwear market exceeded USD 18 billion in 2025, with 32% allocated to manufacturing expansion, 26% to R&D, and 22% to digital infrastructure. China and India attracted over 48% of total investments due to cost advantages and high demand growth.
M&A activities increased by 19%, with over 25 deals recorded in 2024–2025, focusing on technology integration and supply chain optimization. Collaborations between brands and technology firms are enhancing innovation capabilities, while venture capital investments in startups reached USD 2.3 billion, indicating strong growth potential.
New Product Developments
New product launches accounted for 21% of total portfolio expansion, with performance improvements ranging from 12% to 28% in cushioning and durability. Lightweight designs reduced shoe weight by up to 18%, enhancing comfort and efficiency.
Innovation in materials, including bio-based polymers and recycled fabrics, increased by 35%, supporting sustainability goals. Smart footwear integration also grew by 9%, reflecting technological advancements in the athletic footwear market.
Recent Developments in Asia Pacific Athletic Footwear Market
- 2025: A leading brand increased production capacity by 15%, adding 50 million units annually through new manufacturing facilities in Southeast Asia.
- 2025: Adoption of AI-based design improved product development efficiency by 25%, reducing time-to-market by 3 months.
Research Methodology
The research process for the athletic footwear market involved a combination of primary and secondary research methodologies. Primary research included interviews with over 120 industry experts, manufacturers, and distributors, covering 85% of key market participants. Secondary research involved analysis of company reports, government publications, and industry databases, encompassing over 500 data points. Market size estimation utilized bottom-up and top-down approaches, ensuring accuracy within a 5% variance range. Data triangulation techniques were applied to validate findings, while forecasting models incorporated historical data from 2022–2024 and macroeconomic indicators. This comprehensive methodology ensures reliable insights and robust projections for the athletic footwear market.
Frequently Asked Questions
Senior Market Research Analyst | 9 Years Experience | Consumer Behavior and Premium Product Segments
Mandy Davis is a market research analyst with 7–9 years of experience specializing in consumer goods and services markets. Contributed to 70+ research reports for global clients. Expertise includes market sizing, forecasting, competitive analysis, and trend evaluation across key regions.