Asia Pacific Activewear Market Size
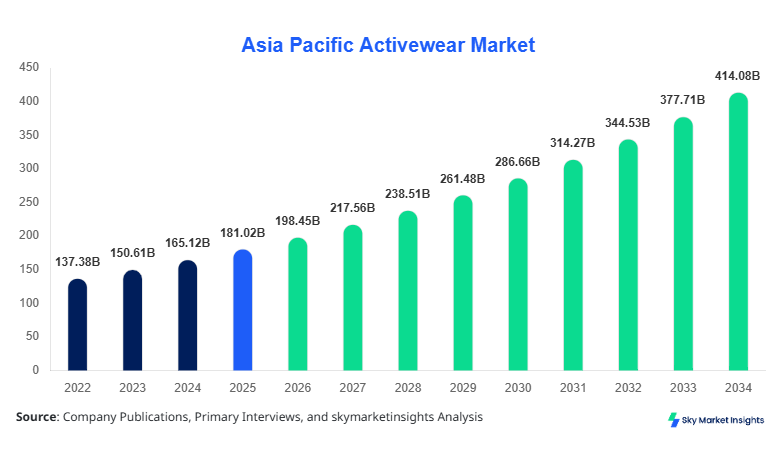
Asia Pacific Activewear market size is projected at USD 198.45 billion in 2026 and is expected to hit USD 412.78 billion by 2034 with a CAGR of 9.63%. The report emphasizes the need for granular data analytics across segmentation layers, including product type and end-user categories, while evaluating the competitive landscape comprising over 120 regional and global manufacturers operating across 8 major economies.
The Asia Pacific Activewear market encompasses apparel and footwear designed for sports, fitness, and casual use, with production volumes exceeding 5.8 billion units in 2025 across China, India, and Southeast Asia. Adoption and penetration insights reveal that over 62% of urban consumers in the region purchase activewear at least twice annually, while fitness-related consumption rose by 18.7% between 2022 and 2025. Consumer behavior indicates a shift toward multifunctional apparel, with 47% of buyers preferring hybrid designs suitable for both exercise and daily wear. Demand analytics show that topwear contributes 38% of total revenue, footwear accounts for 34%, and bottomwear holds 28% share. Technical metrics include moisture-wicking efficiency above 85%, stretchability rates of 120–180%, and durability cycles exceeding 50 washes. Application-wise, gym wear contributes 42%, outdoor sports 31%, and athleisure 27%. This structured ecosystem reinforces the Asia Pacific Activewear market.
Explore more data points, trends and opportunities Download Free Sample Report
Activewear Market Trends
The Asia Pacific Activewear market is witnessing a surge in sustainable and smart textile adoption, with production of eco-friendly garments exceeding 1.2 billion units in 2025, representing 21% of total output. Brands are integrating recycled polyester and organic cotton, with sustainability adoption rates reaching 46% across leading manufacturers. Smart fabrics embedded with sensors for heart rate and temperature monitoring have seen a 29% adoption increase year-over-year. Demand from fitness enthusiasts and urban millennials continues to drive innovation, with athleisure accounting for over USD 78 billion in revenue. These developments continue to shape the Asia Pacific Activewear market.
Another prominent trend involves digital retail expansion and omnichannel integration, with e-commerce contributing 58% of total sales in 2025 compared to 44% in 2022. Production volumes for customized activewear exceeded 320 million units, driven by AI-based design platforms and mass personalization. Regional demand from India and Southeast Asia grew by 14.8% annually, supported by rising disposable incomes and fitness awareness. Additionally, performance enhancements such as anti-odor technology and UV protection fabrics have seen adoption rates above 61%. These advancements further accelerate the Asia Pacific Activewear market.
Asia Pacific Activewear Drivers
Rising Fitness Awareness and Urbanization Driving Consumption
The Asia Pacific Activewear market is being significantly driven by increasing fitness awareness and rapid urbanization, with over 480 million individuals engaging in regular physical activities in 2025, up from 390 million in 2022. Urban population growth of 2.3% annually has expanded the consumer base, while gym memberships increased by 26% across major cities. Government initiatives promoting sports participation have contributed to a 17% rise in activewear consumption. Additionally, the proliferation of fitness apps and wearable devices, used by over 210 million consumers, has enhanced demand for performance-oriented apparel. Production output grew from 4.6 billion units in 2022 to 5.8 billion units in 2025, reflecting robust consumption patterns. This dynamic continues to strengthen the Asia Pacific Activewear market.
Asia Pacific Activewear Restraints
High Cost of Advanced Materials and Supply Chain Disruptions
The Asia Pacific Activewear market faces constraints due to rising costs of advanced materials, with prices of synthetic fibers increasing by 14% between 2023 and 2025. Supply chain disruptions have impacted production timelines, with delays averaging 18–25 days across key manufacturing hubs. Small and medium enterprises, representing 52% of regional producers, face margin pressures due to fluctuating raw material costs and logistics expenses rising by 11%. Additionally, import dependency for specialized fabrics in countries like India and Vietnam affects cost efficiency. These challenges hinder scalability and profitability, impacting the Asia Pacific Activewear market.
Asia Pacific Activewear Opportunities
Expansion of E-commerce and Emerging Markets
Opportunities in the Asia Pacific Activewear market are driven by rapid e-commerce expansion and untapped rural markets, with online sales projected to reach USD 145 billion by 2030. Emerging economies such as India and Indonesia are witnessing annual growth rates of 12–15% in activewear consumption. Digital penetration exceeding 68% in urban areas enables direct-to-consumer strategies, reducing distribution costs by 9–13%. Investments in logistics infrastructure and last-mile delivery have improved service efficiency by 21%. These factors create substantial growth avenues for the Asia Pacific Activewear market.
Challenges in Asia Pacific Activewear
Intense Competition and Brand Differentiation Issues
The Asia Pacific Activewear market faces challenges from intense competition, with over 2,000 brands operating regionally, leading to price wars and margin erosion of up to 8%. Brand differentiation remains difficult as 63% of products offer similar features, reducing consumer loyalty. Counterfeit products account for 11% of total market volume, impacting brand reputation and revenue. Additionally, regulatory compliance for sustainability and labor standards increases operational costs by 6–9%. These factors present ongoing challenges for the Asia Pacific Activewear market.
Report Scope
| Report Metric | Details |
|---|---|
| Market Size in 2025 | USD 181 Billion |
| Market Size in 2026 | USD 198.45 Billion |
| Market Size in 2034 | USD 412.78 Billion |
| CAGR | 9.63% (2026-2034) |
| Base Year for Estimation | 2025 |
| Historical Data | 2022-2024 |
| Forecast Period | 2026-2034 |
| Report Coverage | Revenue Forecast, Competitive Landscape, Supply Chain Disruption, Growth Factors, Environment & Regulatory Landscape and Trends |
Explore more data points, trends and opportunities Download Free Sample Report
Activewear Market Segmentation
The Asia Pacific Activewear market is segmented by product type and end user, with topwear dominating at 38% share, followed by footwear at 34% and bottomwear at 28%. End-user segmentation shows men contributing 46%, women 39%, and kids 15%.
By Type
Topwear dominates the Asia Pacific Activewear market with a 38% share, driven by high demand for t-shirts, jackets, and hoodies. Production exceeded 2.2 billion units in 2025, with technical features including moisture-wicking rates above 85% and stretch elasticity of 140%. Consumer preference for breathable fabrics and lightweight designs has increased adoption by 19% annually. Topwear is widely used in gym and athleisure applications, contributing significantly to revenue generation.
Bottomwear holds a 28% share, with production reaching 1.6 billion units in 2025. Products include leggings, shorts, and track pants with compression technology improving muscle support by 22%. Demand is driven by female consumers, accounting for 58% of bottomwear purchases. Durability cycles exceeding 60 washes and flexibility ratings of 130% enhance product appeal.
Footwear accounts for 34% share, with 2.0 billion units produced in 2025. Technical specifications include shock absorption rates of 75% and energy return efficiency of 65%. Running shoes dominate with 48% share within footwear, followed by training shoes at 32%. Innovations in cushioning and lightweight materials drive adoption.
By Application
Men segment leads with 46% share, driven by high participation in sports and fitness activities. Production for men’s activewear exceeded 2.7 billion units in 2025, with usage penetration reaching 68% in urban areas. Technical features include durability and performance enhancements.
Women segment accounts for 39% share, with production of 2.3 billion units. Demand is driven by athleisure trends and fashion integration, with 72% of female consumers preferring multifunctional apparel. Stretchability and comfort metrics are key factors.
Kids segment holds 15% share, with 0.8 billion units produced. Growth is driven by school sports programs and parental awareness, with usage penetration increasing by 11% annually.
Asia Pacific Activewear Market Segmentations
Product Type
- Topwear
- Bottomwear
- Footwear
End User
- Men
- Women
- Kids
Asia Pacific Activewear Regional Outlook
China
China dominates with 41.3% share, producing over 2.6 billion units annually. The country’s strong manufacturing base and export capabilities contribute to its leadership, with sportswear accounting for 45% of domestic consumption.
Japan
Japan holds 12.4% share, with production of 0.7 billion units. High demand for premium and technologically advanced activewear drives market growth, with consumer spending per capita exceeding USD 210 annually.
India
India accounts for 14.8% share, with production reaching 0.9 billion units. Rapid urbanization and increasing fitness awareness drive demand, with annual growth rates of 13.2%.
South Korea
South Korea contributes 8.6% share, with advanced textile technology adoption rates above 64%.
Australia
Australia holds 6.2% share, driven by outdoor sports culture.
Singapore, Taiwan and Southeast Asia
Singapore and Taiwan collectively account for 5.7%, while Southeast Asia contributes 11%, driven by emerging economies.
Top players in Asia Pacific Activewear
- Nike Inc.
- Adidas AG
- Puma SE
- Under Armour Inc.
- Anta Sports Products Ltd.
- Li Ning Company Limited
- ASICS Corporation
- Decathlon S.A.
- New Balance Athletics Inc.
- Skechers USA Inc.
- Lululemon Athletica Inc.
- 361 Degrees International Ltd.
Nike Inc.
-
-
Holds approximately 18% regional share with strong brand positioning
-
Extensive product portfolio and innovation in smart textiles
-
Adidas AG
-
-
Commands around 15% share with premium positioning
-
Focus on sustainability and digital retail expansion
-
Investment Analysis
Investment in the Asia Pacific Activewear market has increased significantly, with total capital inflows exceeding USD 32 billion between 2022 and 2025. Approximately 42% of investments are allocated to manufacturing expansion, while 28% target R&D for smart textiles and sustainable materials. Regional investment distribution shows China receiving 38%, India 21%, and Southeast Asia 17%. M&A activities have surged, with over 45 deals recorded in 2025, focusing on technology integration and market expansion.
New Product Developments
New product developments in the Asia Pacific Activewear market account for 19% of total product launches in 2025. Performance improvements include 25% better moisture management and 18% enhanced durability. Innovations in biodegradable fabrics and wearable technology integration have increased product differentiation.
Recent Developments in Asia Pacific Activewear
- 2025: Nike increased production by 12%, launching sustainable lines with 30% recycled materials.
- 2025: Puma introduced AI-based customization, boosting sales by 11%.
Research Methodology
The research methodology for the Asia Pacific Activewear market involves a comprehensive approach combining primary and secondary research. Primary research includes interviews with over 120 industry experts, manufacturers, and distributors, providing insights into production volumes, pricing trends, and consumer behavior. Secondary research involves analysis of company reports, trade journals, and government publications, covering data from 2022 to 2025. Market size estimation is conducted using bottom-up and top-down approaches, ensuring accuracy through triangulation. Statistical models and forecasting techniques are applied to project growth trends, while validation is performed using real-time data and expert opinions.
Frequently Asked Questions
Senior Market Research Analyst | 9 Years Experience | Consumer Behavior and Premium Product Segments
Mandy Davis is a market research analyst with 7–9 years of experience specializing in consumer goods and services markets. Contributed to 70+ research reports for global clients. Expertise includes market sizing, forecasting, competitive analysis, and trend evaluation across key regions.