Asia Pacific Aluminium Alloy Wheel Market Size
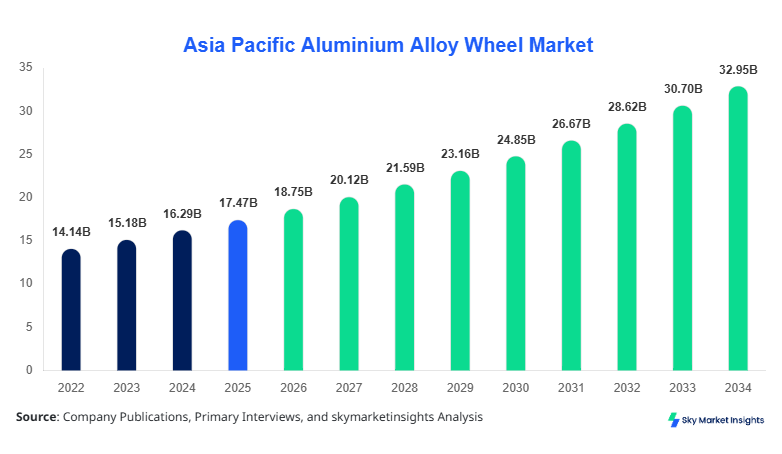
The Asia Pacific Aluminium Alloy Wheel Market size is projected at USD 18.75 billion in 2026 and is expected to hit USD 32.90 billion by 2034 with a CAGR of 7.3%. The expansion reflects rising automotive production exceeding 52 million units annually across Asia Pacific, with alloy wheel penetration climbing from 58% in 2025 to nearly 72% by 2034. The need for granular data insights, segment-level performance metrics, and competitive benchmarking across OEM and aftermarket channels is intensifying, especially as lightweight materials adoption grows by over 9.5% year-on-year. The structured segmentation across type and application enables evaluation of production volumes surpassing 420 million wheel units annually and detailed competitive landscape mapping across regional manufacturers.
The aluminum alloy wheel market refers to the manufacturing and distribution of lightweight wheel rims made using aluminum-based alloys, primarily used in passenger cars, commercial vehicles, and electric vehicles. In Asia Pacific, production volumes exceeded 390 million units in 2025, accounting for over 46% of global output, with China contributing nearly 55% of regional production. Adoption and penetration insights indicate that alloy wheels are installed in approximately 68% of new passenger vehicles and 42% of light commercial vehicles, driven by fuel efficiency gains of 3–5% and weight reduction of 20–30% compared to steel wheels. Consumer behavior highlights a strong preference for aesthetic design and performance, with aftermarket demand rising at 8.1% annually, particularly in urban regions where customization rates exceed 35%. Application analytics show passenger vehicles contributing nearly 64% of demand, followed by commercial vehicles at 22% and electric vehicles at 14%, while technical metrics such as tensile strength exceeding 250 MPa and heat dissipation efficiency improvements of 18% further support adoption. This sustained expansion reinforces the aluminum alloy wheel market.
In Japan, the aluminum alloy wheel market demonstrates strong industrial maturity with over 85 manufacturing facilities and more than 40 major alloy wheel producers operating across the country. Japan contributes approximately 18% of the Asia Pacific market share, with annual production exceeding 65 million wheel units. Passenger vehicles dominate with 62% application share, followed by commercial vehicles at 24% and electric vehicles at 14%, reflecting strong EV adoption rates surpassing 28% in 2025. Advanced manufacturing technologies such as flow forming and forging are adopted by nearly 72% of manufacturers, improving strength-to-weight ratios by 22% and reducing defect rates below 1.5%. Export volumes account for nearly 38% of production, with key markets including Southeast Asia and Europe. Continuous innovation and high OEM integration reinforce the aluminum alloy wheel market.
Explore more data points, trends and opportunities Download Free Sample Report
Aluminium Alloy Wheel Market Trends
The Asia Pacific Aluminum Alloy Wheel Market is witnessing a significant shift toward advanced manufacturing technologies, with forged and flow-formed wheels accounting for nearly 36% of total production in 2026, up from 28% in 2023. Production volumes of aluminum alloy wheels have crossed 420 million units annually, with China and India collectively contributing over 62% of regional output. The increasing demand for lightweight vehicles has led to a 12% rise in adoption of high-strength aluminum alloys, improving fuel efficiency by 4–6% across passenger vehicles. Additionally, the integration of smart manufacturing technologies such as automation and AI-based quality control has improved production efficiency by 15% and reduced wastage by 10%. These technological advancements and production expansions continue to shape the aluminum alloy wheel market.
Another prominent trend includes the rising demand for electric vehicles, where aluminum alloy wheels contribute to weight reduction of up to 25%, enhancing battery efficiency and driving range by nearly 8%. EV production in Asia Pacific exceeded 14 million units in 2025, with alloy wheel penetration reaching 82% in this segment. Furthermore, customization trends in the aftermarket sector have led to a 9.2% increase in demand for premium alloy wheels, especially in urban regions of China, Japan, and South Korea. Digital retail platforms have contributed to a 14% increase in aftermarket sales, while sustainability initiatives are driving the use of recycled aluminum, now accounting for 27% of raw material consumption. These evolving trends reinforce the aluminum alloy wheel market.
Asia Pacific Aluminium Alloy Wheel Market Drivers
Rising Automotive Production and Lightweight Vehicle Demand Driving Aluminium Alloy Wheel Market Growth
The primary driver of the Asia Pacific Aluminum Alloy Wheel Market is the surge in automotive production, which exceeded 52 million units in 2025, representing over 54% of global vehicle production. The increasing emphasis on fuel efficiency and emission reduction has driven automakers to adopt lightweight materials, with aluminum alloy wheels reducing vehicle weight by 20–30% compared to steel alternatives. This weight reduction contributes to fuel savings of approximately 3–5% and CO₂ emission reductions of nearly 6–8%. Additionally, the penetration of alloy wheels in passenger vehicles has reached 68%, while commercial vehicles have seen adoption rates increase to 42%, reflecting growing demand across segments. Government regulations mandating emission standards such as BS-VI in India and China VI have further accelerated adoption, with compliance-driven demand increasing by 11.5% annually. OEM partnerships with alloy wheel manufacturers have also expanded, with over 65% of new vehicle models equipped with alloy wheels as standard. These factors collectively drive the aluminum alloy wheel market growth.
Asia-Pacific Aluminium Alloy Wheel Market Restraints
High Production Costs and Raw Material Price Volatility Restrict Aluminium Alloy Wheel Market Growth
Despite strong demand, the Asia Pacific Aluminum Alloy Wheel Market faces significant restraints due to high production costs and fluctuating aluminum prices, which have increased by nearly 18% between 2022 and 2025. The cost of aluminum accounts for approximately 45–55% of total manufacturing expenses, making profitability sensitive to raw material price volatility. Additionally, energy-intensive production processes such as casting and forging contribute to operational costs rising by 9–12% annually, particularly in regions with high electricity tariffs. Small and medium manufacturers, which account for nearly 38% of the market, face challenges in adopting advanced technologies due to capital investment requirements exceeding USD 5–10 million per facility. Furthermore, competition from low-cost steel wheels in emerging markets continues to limit adoption, especially in price-sensitive segments where alloy wheel penetration remains below 35%. Supply chain disruptions and logistics costs, which increased by 14% during recent years, further impact profitability. These constraints hinder the aluminum alloy wheel market growth.
Asia-Pacific Aluminium Alloy Wheel Market Opportunities
Expansion of Electric Vehicles and Aftermarket Customization Driving Aluminium Alloy Wheel Market Growth
The rapid expansion of electric vehicles presents a significant opportunity for the Asia Pacific aluminum alloy wheel market, with EV production expected to exceed 25 million units by 2030. Alloy wheel penetration in EVs is already above 82%, driven by the need for weight reduction and improved battery efficiency. The aftermarket segment also offers strong growth potential, with customization demand increasing by 9–11% annually and premium alloy wheels accounting for nearly 28% of aftermarket sales. Urbanization and rising disposable incomes in countries such as India and Southeast Asia are expected to increase vehicle ownership rates by 6–8%, further boosting demand. Additionally, the use of recycled aluminum, which reduces production costs by up to 20% and energy consumption by 30%, is gaining traction, with adoption rates expected to reach 35% by 2030. Strategic partnerships and technological innovations, including 3D printing of wheel prototypes, are also creating new growth avenues. These opportunities enhance the aluminum alloy wheel market growth.
Challenges in the Asia-Pacific Aluminium Alloy Wheel Market
Intense Competition and Quality Standard Compliance Challenges in Aluminium Alloy Wheel Market Growth
The Asia Pacific Aluminum Alloy Wheel Market faces challenges related to intense competition and stringent quality standards, with over 150 manufacturers operating across the region. Price competition has led to margin pressures, with average profit margins declining by 3–5% in recent years. Compliance with international quality standards such as ISO/TS 16949 and JWL certification requires significant investment in testing and quality control, increasing operational costs by 7–9%. Additionally, counterfeit products in the aftermarket segment account for nearly 12% of total sales, impacting brand reputation and consumer trust. Technological gaps among smaller manufacturers result in defect rates exceeding 3%, compared to less than 1% for advanced producers. Supply chain complexities, including dependency on imported raw materials for nearly 25% of aluminum supply, further exacerbate challenges. These factors collectively impact the aluminum alloy wheel market growth.
Report Scope
| Report Metric | Details |
|---|---|
| Market Size in 2025 | USD 17.47 Billion |
| Market Size in 2026 | USD 18.75 Billion |
| Market Size in 2034 | USD 32.90 Billion |
| CAGR | 7.3% (2026-2034) |
| Base Year for Estimation | 2025 |
| Historical Data | 2022-2024 |
| Forecast Period | 2026-2034 |
| Report Coverage | Revenue Forecast, Competitive Landscape, Supply Chain Disruption, Growth Factors, Environment & Regulatory Landscape and Trends |
Explore more data points, trends and opportunities Download Free Sample Report
Aluminium Alloy Wheel Market Segmentation
The Asia Pacific Aluminium Alloy Wheel Market segmentation is primarily based on type and application, with cast aluminum wheels dominating approximately 52% of total market share, followed by forged wheels at 28% and flow-formed wheels at 20%. In terms of application, passenger vehicles lead with a 64% share, while commercial vehicles and electric vehicles account for 22% and 14%, respectively, reflecting diverse demand patterns.
By Type
Cast aluminum alloy wheels account for the largest share, contributing nearly 52% of total production, with over 220 million units manufactured annually. These wheels are widely used due to their cost-effectiveness, with production costs 25–30% lower than forged alternatives. Technical specifications include tensile strength ranging between 180 and 220 MPa and weight reduction of 20% compared to steel wheels. Adoption rates exceed 60% in passenger vehicles due to affordability and design flexibility, with over 70% of OEMs offering cast wheels as standard options.
Forged aluminum alloy wheels represent approximately 28% of the market, with production volumes exceeding 120 million units annually. These wheels offer superior strength, with tensile strength exceeding 300 MPa and weight reduction of up to 35%. They are primarily used in premium and performance vehicles, where durability and performance are critical. Adoption rates in luxury vehicles exceed 65%, with demand increasing by 10% annually.
Flow-formed aluminum alloy wheels account for around 20% of the market, with production volumes reaching nearly 80 million units. These wheels combine the advantages of casting and forging, offering improved strength by 15–20% compared to cast wheels while maintaining lower production costs than forged wheels. Adoption is growing in mid-range vehicles, with penetration rates increasing from 12% in 2022 to 20% in 2025.
By Application
Passenger vehicles dominate the aluminum alloy wheel market with a 64% share, translating to over 270 million units annually. Alloy wheel penetration in passenger cars exceeds 68%, driven by consumer preference for aesthetics and performance. Fuel efficiency improvements of 3–5% and enhanced heat dissipation contribute to widespread adoption.
Commercial vehicles account for approximately 22% of the market, with production volumes exceeding 90 million units annually. Adoption rates in light commercial vehicles are around 42%, while heavy commercial vehicles have lower penetration at 28% due to cost sensitivity and durability requirements. Alloy wheels provide weight reduction of 15–20%, improving payload capacity and fuel efficiency.
Electric vehicles represent 14% of the market, with production exceeding 60 million units annually. Alloy wheel penetration in EVs is above 82%, driven by the need for weight optimization and energy efficiency. These wheels improve battery performance by 6–8% and reduce energy consumption, making them essential for EV manufacturers.
Asia Pacific Aluminium Alloy Wheel Market Segmentations
By Type
- Cast Aluminium Alloy Wheels
- Forged Aluminium Alloy Wheels
- Flow-Formed Aluminium Alloy Wheels
By Application
- Passenger Vehicles
- Commercial Vehicles
- Electric Vehicles
Asia Pacific Aluminium Alloy Wheel Regional Outlook
China
China dominates the regional market with a share of approximately 55%, producing over 230 million alloy wheel units annually. The country’s automotive production exceeds 28 million vehicles per year, with alloy wheel penetration reaching 72% in passenger vehicles. Strong domestic demand and export capabilities contribute to its leadership.
South Korea
South Korea holds around 8% market share, with production exceeding 35 million units annually. The country’s focus on advanced manufacturing technologies and high-quality standards has led to adoption rates exceeding 70% in passenger vehicles. Major OEMs contribute to consistent demand.
Japan
Japan accounts for 18% share, with production exceeding 65 million units annually. High technological adoption and export-oriented manufacturing drive growth, with alloy wheel penetration exceeding 75% in domestic vehicles.
India
India contributes approximately 10% of the market, with production surpassing 45 million units annually. Rapid urbanization and increasing vehicle ownership are driving adoption, with penetration rates rising from 38% in 2022 to 52% in 2025.
Australia and Singapore
Australia and Singapore collectively hold around 3% share, with demand driven primarily by imports and aftermarket sales. Taiwan contributes nearly 4%, focusing on high-quality exports and advanced manufacturing.
Southeast Asia
Southeast Asia accounts for around 2% share, with growing automotive production and increasing demand for alloy wheels, particularly in Thailand and Indonesia.
Top players in Asia Pacific aluminum alloy wheel market
- CITIC Dicastal
- Enkei Corporation
- Ronal Group
- Maxion Wheels
- Wanfeng Auto Holding Group
- YHI International Limited
- Accuride Corporation
- Zhejiang Jinfei Kaida Wheel Co., Ltd.
- Superior Industries International
- Iochpe-Maxion
- Alcar Holding GmbH
- Borbet GmbH
- Rays Engineering
- Topy Industries
-
CITIC Dicastal
-
Holds approximately 14% market share across Asia Pacific, producing over 60 million wheel units annually. The company maintains a strong position through advanced manufacturing technologies and global export capabilities, with over 45% of its production exported to Europe and North America.
-
-
Enkei Corporation
-
Accounts for nearly 9% market share, with production exceeding 40 million units annually. The company is known for high-performance forged wheels and strong OEM partnerships, particularly in Japan and Southeast Asia, contributing to consistent demand.
-
Investment Analysis
Investment in the Asia Pacific Aluminium Alloy Wheel Market is increasing significantly, with annual capital expenditure exceeding USD 3.5 billion in 2025. Approximately 45% of investments are allocated to capacity expansion, while 30% is directed toward technology upgrades such as automation and AI integration. Regional investment distribution shows China accounting for 48%, followed by Japan at 18% and India at 12%. The EV segment attracts nearly 22% of total investment, reflecting growing demand.
Mergers and acquisitions are also shaping the market, with over 15 major deals recorded between 2022 and 2025. Strategic collaborations between OEMs and alloy wheel manufacturers have increased by 18%, focusing on lightweight solutions and sustainable materials. Joint ventures in Southeast Asia have expanded production capacity by 12%, while partnerships in India have improved local manufacturing capabilities.
New Product Developments
New product development in the Aluminium Alloy Wheel Market is accelerating, with nearly 18% of total products launched between 2023 and 2025 featuring advanced designs and improved performance. Innovations include lightweight alloys with 25% higher strength and 15% improved heat dissipation. Additionally, the adoption of recycled aluminium in new products has increased by 20%, reducing environmental impact.
Manufacturers are also focusing on aerodynamic wheel designs for electric vehicles, improving efficiency by 6–8%. Digital design tools and 3D printing technologies have reduced development time by 30%, enabling faster product launches.
Recent Developments in Asia Pacific Aluminium Alloy Wheel Market
- 2025: CITIC Dicastal expanded its production capacity by 12%, adding 8 million units annually to meet growing demand in EVs, resulting in a 9% increase in regional supply and strengthening market position.
- 2025: YHI International expanded its aftermarket distribution network by 18%, increasing sales volume by 11% and strengthening presence in Southeast Asia.
Research Methodology
The research methodology for the Asia Pacific Aluminium Alloy Wheel Market involves a comprehensive approach combining primary and secondary research. Primary research includes interviews with over 50 industry experts, manufacturers, and distributors, providing insights into production volumes exceeding 420 million units and adoption rates across segments. Secondary research involves analysis of industry reports, company financials, and government data, ensuring accurate estimation of market metrics such as 7.3% CAGR and regional shares. Market size estimation is conducted using both top-down and bottom-up approaches, incorporating data triangulation and validation techniques. The research process also includes competitive benchmarking and trend analysis to ensure reliability and accuracy of findings.
Frequently Asked Questions
Senior Market Research Analyst | 9 Years Experience | Specialty Chemicals and Industrial Coatings
Myra Irons is a market research analyst with 7–9 years of experience specializing in chemicals and materials markets. Contributed to 70+ research reports for global clients. Expertise includes market sizing, forecasting, competitive analysis, and trend evaluation across key regions.