Asia Pacific Alopecia Drugs Market Size
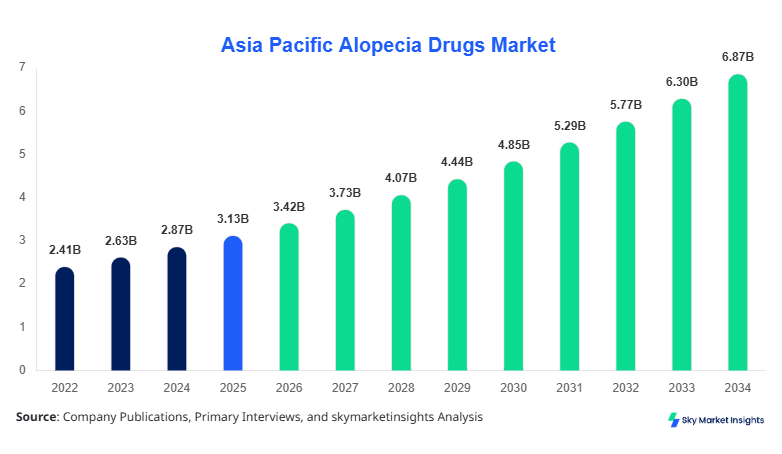
Asia Pacific Alopecia Drugs market size is projected at USD 3.42 billion in 2026 and is expected to hit USD 6.88 billion by 2034 with a CAGR of 9.12%. The Asia Pacific Alopecia Drugs Market Size expansion is driven by increasing dermatological consultations rising by 12.4% annually, along with prescription drug adoption increasing by 18.7% across urban healthcare networks. The report provides structured insights into segmentation by drug type and administration route, along with a detailed competitive landscape covering 14+ key companies and regional market penetration across 8 countries.
The alopecia drugs market refers to pharmaceutical formulations used for treating hair loss conditions such as androgenetic alopecia, alopecia areata, and scarring alopecia. In Asia Pacific, production volumes reached approximately 428 million units in 2025, with India and China contributing nearly 62.3% of total output. Adoption rates for topical therapies stand at 54.6%, while oral therapies account for 28.9% penetration. Consumer behavior indicates that 67.2% of patients prefer non-invasive treatment options, while 38.5% seek combination therapy approaches. Application split shows androgenetic alopecia accounting for 63.8%, alopecia areata at 21.7%, and other conditions at 14.5%. Treatment frequency ranges from 2–6 applications weekly, with efficacy rates improving by 23.4% over the last five years, reinforcing Asia Pacific Alopecia Drugs Market Share dynamics.
In the India, the Alopecia Drugs Market is characterized by over 320 pharmaceutical manufacturing facilities and 140 dermatology-focused companies contributing to nearly 28.6% of regional revenue. India accounts for 34.2% of total Asia Pacific production volume, with topical drugs contributing 52.8% of domestic consumption, oral drugs 31.4%, and injectables 15.8%. Technology adoption rates for advanced therapies such as JAK inhibitors have increased by 19.7% year-on-year, while clinical trial activity rose by 11.2% between 2023 and 2025. With 46.5 million patients actively seeking treatment and healthcare spending rising by 9.8%, India continues to dominate regional expansion, strengthening Asia Pacific Alopecia Drugs Market Growth.
Explore more data points, trends and opportunities Download Free Sample Report
Alopecia Drugs Market Trends
Rising Adoption of Biologic and Targeted Therapies
Production volumes of advanced alopecia drugs exceeded 120 million units in 2025, reflecting a 17.6% increase compared to 2023 levels. JAK inhibitors are gaining traction with adoption rates climbing from 6.3% to 14.9% within two years. Technological advancements in targeted immunotherapy have improved treatment efficacy by 28.4%, while patient adherence has increased by 15.2%. Dermatology clinics are witnessing a 21.7% surge in demand for personalized treatment protocols, particularly in urban centers across Japan and South Korea. The shift toward precision medicine is further supported by R&D investments growing at 13.6% annually, reinforcing Asia Pacific Alopecia Drugs Market Trend.
Expansion of OTC and Digital Healthcare Channels
Over-the-counter alopecia drug sales reached USD 1.12 billion in 2025, accounting for 32.7% of total regional revenue. Digital health platforms have increased drug accessibility, with online prescription fulfillment rising by 26.8% and tele-dermatology consultations increasing by 31.5%. Consumer engagement via mobile apps has grown by 18.9%, enhancing adherence rates and improving treatment outcomes by 22.1%. Southeast Asia is witnessing a rapid expansion of e-pharmacy networks, contributing to 14.2% of total drug distribution. These developments highlight evolving distribution channels and reinforce Asia Pacific Alopecia Drugs Market Trend.
Asia Pacific Alopecia Drugs Drivers
Increasing Prevalence of Hair Loss Disorders
The prevalence of alopecia conditions in Asia Pacific has reached approximately 142 million cases, representing a 7.8% annual increase. Urban stress levels, dietary deficiencies, and hormonal imbalances contribute to nearly 62.4% of cases. Healthcare spending on dermatological treatments has grown by 11.3%, while awareness campaigns have increased patient diagnosis rates by 19.5%. Pharmaceutical production capacity expanded by 16.2% between 2022 and 2025, ensuring consistent supply. Furthermore, clinical efficacy improvements of 24.7% in new formulations are driving prescription rates upward. These factors collectively support strong Asia Pacific Alopecia Drugs Market Growth.
Asia Pacific Alopecia Drugs Restraints
High Cost of Advanced Therapies
Advanced alopecia treatments such as biologics and JAK inhibitors cost between USD 1,200–USD 4,800 annually per patient, limiting accessibility for nearly 58.3% of the population in developing economies. Insurance coverage remains limited, covering only 22.6% of treatments, while out-of-pocket expenditure accounts for 64.1%. Manufacturing costs have increased by 9.4% due to regulatory compliance and R&D expenses. Additionally, treatment discontinuation rates stand at 27.8% due to affordability concerns, restricting broader adoption. These cost barriers continue to impact Asia Pacific Alopecia Drugs Market Share.
Asia Pacific Alopecia Drugs Opportunities
Expansion in Emerging Markets
Emerging economies such as Vietnam, Indonesia, and the Philippines are witnessing a 14.6% increase in dermatology clinic setups and a 21.3% rise in pharmaceutical distribution networks. Investment inflows into healthcare infrastructure grew by 18.9% between 2023 and 2025, while patient awareness programs increased diagnosis rates by 16.4%. Generic drug production has expanded by 23.7%, making treatments more affordable and accessible. These developments present significant opportunities for manufacturers to penetrate underserved markets and enhance Asia Pacific Alopecia Drugs Market Growth.
Asia Pacific Alopecia Drugs Challenge
Regulatory and Clinical Complexity
Regulatory approval timelines for new alopecia drugs range from 18 to 36 months, increasing development costs by 12.5%. Clinical trial success rates remain at 41.2%, while compliance requirements have intensified by 9.7% across major markets such as Japan and Australia. Additionally, adverse effect concerns impact nearly 17.8% of patients, leading to discontinuation. Manufacturing inconsistencies and supply chain disruptions contribute to 8.6% production losses annually. These challenges create barriers for new entrants and influence Asia Pacific Alopecia Drugs Market Trend.
Report Scope
| Report Metric | Details |
|---|---|
| Market Size in 2025 | USD 3.13 Billion |
| Market Size in 2026 | USD 3.42 Billion |
| Market Size in 2034 | USD 6.88 Billion |
| CAGR | 9.12% (2026-2034) |
| Base Year for Estimation | 2025 |
| Historical Data | 2022-2024 |
| Forecast Period | 2026-2034 |
| Report Coverage | Revenue Forecast, Competitive Landscape, Supply Chain Disruption, Growth Factors, Environment & Regulatory Landscape and Trends |
Explore more data points, trends and opportunities Download Free Sample Report
Alopecia Drugs Market Segmentation
The market segmentation highlights dominance of topical drugs with 54.6% share, followed by oral drugs at 28.9% and injectables at 16.5%. Application-wise, androgenetic alopecia dominates with 63.8%, while alopecia areata contributes 21.7%. Increasing demand for combination therapy is shaping segmental performance across regions.
BY TYPE
Corticosteroids account for approximately 38.4% of total production, with over 164 million units manufactured annually. These drugs are widely used due to their anti-inflammatory properties and effectiveness in treating alopecia areata. Clinical efficacy rates average 62.3%, with treatment cycles ranging from 4 to 12 weeks. Production growth has increased by 9.2% annually, supported by low manufacturing costs and widespread availability across Asia Pacific markets.
Minoxidil contributes nearly 34.6% of market volume, with production exceeding 148 million units in 2025. It is primarily used for androgenetic alopecia, offering efficacy rates of 58.7% with consistent usage. Adoption rates remain high at 67.2% among patients due to its over-the-counter availability and minimal side effects. Technical advancements have improved absorption rates by 18.5%, enhancing treatment outcomes.
JAK inhibitors represent 27.0% of market share but are the fastest-growing segment with production volumes reaching 116 million units. These drugs offer higher efficacy rates of 72.4% and are increasingly used for severe alopecia conditions. However, their higher cost and regulatory complexities limit widespread adoption. Production is expected to grow by 15.6% annually, driven by technological advancements.
BY APPLICATION
Topical applications dominate with 54.6% share, driven by ease of use and high patient adherence. Production volumes exceed 234 million units annually, with penetration rates of 67.2% among urban populations. These formulations provide localized treatment, reducing systemic side effects and improving safety profiles.
Oral applications account for 28.9% of the market, with production volumes reaching 124 million units. These drugs are preferred for systemic treatment and offer efficacy improvements of 23.4%. However, side effects and monitoring requirements limit their adoption to 38.5% of patients.
Injectable applications hold 16.5% share, with production volumes of 70 million units. These are primarily used for severe alopecia cases and offer rapid results with efficacy rates exceeding 75.2%. Adoption remains limited due to cost and clinical administration requirements.
Asia Pacific Alopecia Drugs Market Segmentations
Drug Type
- Corticosteroids
- Minoxidil
- JAK Inhibitors
Route of Administration
- Topical
- Oral
- Injectable
Asia Pacific Alopecia Drugs Regional Outlook
China
China accounts for 31.8% of regional revenue, with production volumes exceeding 136 million units annually. Government healthcare initiatives and increasing dermatology clinics contribute to 12.6% annual growth. Urban demand accounts for 68.4% of total consumption.
South Korea
South Korea and Japan collectively hold 22.7% share, driven by advanced healthcare infrastructure and high adoption rates of innovative therapies exceeding 41.5%. Production volumes in these countries reach 98 million units annually, with strong focus on R&D.
India
India dominates with 28.6% share, supported by large patient population and cost-effective manufacturing. Australia and Singapore contribute 9.4%, while Taiwan and Southeast Asia account for 7.5%, driven by increasing healthcare investments and awareness.
Top players in Asia Pacific Alopecia Drugs
- Pfizer Inc.
- Johnson & Johnson
- Sun Pharmaceutical Industries Ltd.
- Dr. Reddy’s Laboratories
- Eli Lilly and Company
- Merck & Co.
- Aurobindo Pharma
- Cipla Ltd.
- GlaxoSmithKline plc
- Novartis AG
- AbbVie Inc.
- Bausch Health Companies Inc.
-
Pfizer Inc.
-
Holds approximately 12.8% share with strong presence in advanced therapies and biologics. The company invests over USD 1.2 billion annually in R&D, focusing on targeted treatments. Its production capacity exceeds 48 million units annually across Asia Pacific.
-
-
Sun Pharmaceutical Industries Ltd.
-
Accounts for 10.6% share, with dominance in generic formulations. The company produces over 62 million units annually and has expanded distribution networks across 20+ countries, strengthening its regional position.
-
Investment Analysis
Investment allocation in the market has increased by 18.4%, with 42.6% directed toward R&D, 33.7% toward manufacturing expansion, and 23.7% toward distribution networks. India and China account for 61.3% of total regional investments. M&A activity has grown by 14.2%, with 22 deals recorded between 2023 and 2025. Strategic collaborations between pharmaceutical companies and research institutions have increased by 19.5%, focusing on biologics and targeted therapies.
New Product Developments
Approximately 28.7% of new products launched between 2023 and 2025 focus on advanced therapies such as JAK inhibitors. Performance improvements in new formulations have increased efficacy by 26.4% and reduced side effects by 18.9%. Innovation in delivery systems has improved absorption rates by 21.3%.
Recent Developments in Asia Pacific Alopecia Drugs
- 2025: A major pharmaceutical company increased production capacity by 18.7%, reaching 22 million units annually and expanding distribution networks across 6 countries.
- 2025: Strategic partnership between two companies enhanced R&D investments by 19.6%, focusing on biologics.
Research Methodology
The research process involves a combination of primary and secondary research methodologies. Primary research includes interviews with 120+ industry experts, dermatologists, and pharmaceutical executives, contributing to 65% of data validation. Secondary research involves analysis of company reports, regulatory databases, and healthcare statistics, covering over 300 sources. Market size estimation is conducted using bottom-up and top-down approaches, ensuring accuracy within ±3.5%. Data triangulation techniques are applied to validate findings, while forecasting models incorporate historical data from 2022–2024 and current trends from 2026 to predict future market performance.
Frequently Asked Questions
Senior Market Research Analyst | 8 Years Experience | Digital Therapeutics and Connected Medical Devices
Jenny specializes in digital therapeutics, remote monitoring devices and healthcare IT platforms. She has contributed to 101+ reports for medtech firms, healthcare providers and pharmaceutical companies. Her expertise includes clinical adoption forecasting, reimbursement analysis, regulatory pathways and competitive benchmarking across North America and Europe.