Asia Pacific Aerosol Cans Market Size
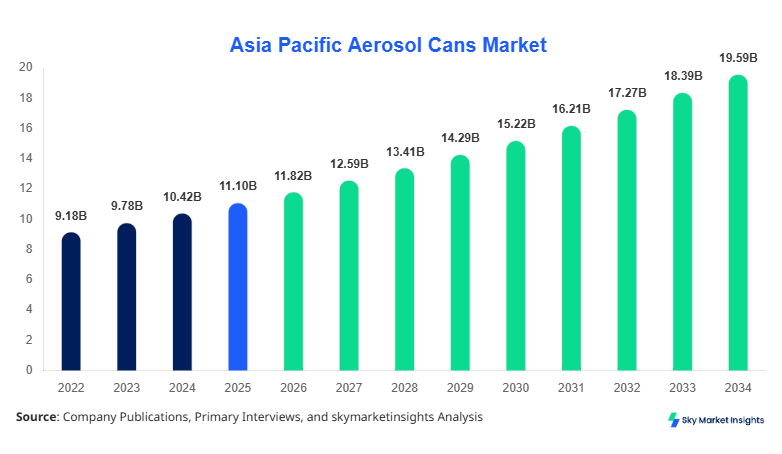
The Asia Pacific aerosol cans market size is projected at USD 11.82 billion in 2026 and is expected to hit USD 19.64 billion by 2034 with a CAGR of 6.52%. The Asia Pacific aerosol cans market size reflects strong industrial demand, increasing packaging standardisation, and a rising consumer base exceeding 2.3 billion urban users. Data-driven segmentation highlights aluminium cans accounting for nearly 62.4% volume share, while personal care applications dominate with 41.8% consumption. Competitive landscape evaluation shows over 350 manufacturers operating across China, Japan, and India, producing more than 58 billion units annually. Increasing automation in production lines, achieving efficiency rates above 92%, further enhances operational output, strengthening the Asia Pacific Aerosol Cans market size outlook.
The Asia Pacific aerosol cans market is defined by the production and distribution of pressurised containers used for dispensing liquids, foams, and sprays, with total regional production exceeding 60 billion units in 2025, growing at 5.8% annually. Adoption rates across urban households reached 68%, while industrial usage penetration stands at 54%, indicating dual demand streams. Consumer behaviour indicates that 73% of buyers prefer aerosol packaging for convenience, while 61% prioritise recyclability and lightweight materials. Aluminium cans contribute 62.4% of total production, steel cans 33.1%, and others 4.5%, reflecting material efficiency metrics such as corrosion resistance above 95% and pressure tolerance exceeding 8 bar. The application split shows personal care at 41.8%, household at 28.7%, and automotive & industrial at 29.5%, with usage frequency averaging 3.2 units per capita annually. Increasing demand for eco-friendly propellants and recyclable packaging continues to reinforce the Asia Pacific Aerosol Cans market share across multiple sectors.
In China, the aerosol cans market leads regional production with over 27 billion units annually, accounting for approximately 46.3% of Asia Pacific volume. The country hosts more than 140 manufacturing facilities and over 120 active companies, with industrial clusters concentrated in Guangdong, Jiangsu, and Zhejiang. Application breakdown shows personal care contributing 44.2%, household 26.5%, and automotive & industrial 29.3%, reflecting diversified demand. Technology adoption rates exceed 78% for automated filling systems and 64% for eco-friendly propellant integration. Aluminium cans dominate with a 65.1% share due to lightweight efficiency and recyclability above 92%, while steel cans account for 30.7%. Increasing domestic consumption, driven by 71% urban population usage, continues to strengthen the aerosol can market's growth across China.
Explore more data points, trends and opportunities Download Free Sample Report
Aerosol Cans Market Trends
Shift Toward Sustainable Packaging Materials
The aerosol can market trend indicates a strong shift toward sustainable materials, with aluminium recycling rates surpassing 93% and steel recycling at 85%, contributing to reduced carbon emissions by nearly 38%. Production volumes for eco-friendly cans reached 22 billion units in 2025, representing 37% of total output, and are expected to grow at 8.2% annually. Companies are adopting water-based coatings with VOC emissions reduced by 45%, while bio-based propellants now account for 18% of usage. Demand from environmentally conscious consumers, representing 64% of total buyers, is accelerating innovation in lightweight designs with thickness reduced by 12% without compromising pressure tolerance. This sustainability-driven transformation continues to influence the aerosol cans market trend.
Automation and Smart Manufacturing Integration
Automation is transforming production, with over 72% of facilities integrating robotic systems and IoT-enabled monitoring, improving efficiency by 28% and reducing downtime by 19%. Smart manufacturing adoption has enabled output increases from 58 billion units in 2024 to over 62 billion units in 2026. Real-time quality monitoring ensures defect rates below 1.5%, while predictive maintenance reduces operational costs by 14%. Industry 4.0 integration is particularly strong in Japan and South Korea, where 81% of manufacturers use AI-based inspection systems. This technological advancement significantly enhances production scalability and reinforces the aerosol cans market trend.
Asia Pacific Aerosol Cans Market Drivers
Rising Demand from Personal Care and Household Sectors
The rapid expansion of personal care and household sectors is a primary driver, with personal care consumption exceeding 24 billion units annually and growing at 6.8%. Household products contribute an additional 17 billion units, reflecting increased urbanisation rates of 62% across the Asia Pacific. Demand for deodorants, hair sprays, and disinfectants has increased by 21% since 2022, while penetration rates for aerosol-based cleaning products have reached 58% in metropolitan regions. Manufacturing output has scaled accordingly, with production capacity utilisation rising to 89% across major plants. The combination of convenience, portability, and controlled dispensing continues to fuel the aerosol can market's growth.
Asia Pacific Aerosol Cans Market Restraints
Environmental Concerns and Regulatory Compliance
Despite growth, environmental regulations pose significant restraints, with compliance costs increasing by 18% annually for manufacturers. Restrictions on hydrocarbon propellants and stringent emission standards have reduced production flexibility by 12% in certain regions. Approximately 27% of manufacturers face operational challenges due to evolving regulations, while recycling infrastructure limitations in developing economies affect 35% of total output. Additionally, consumer concerns about chemical exposure have reduced adoption rates by 9% in specific segments. These regulatory and environmental challenges constrain the aerosol can market's growth.
Asia Pacific Aerosol Cans Market Opportunities
Expansion in Emerging Economies
Emerging economies such as India and Southeast Asia present substantial opportunities, with demand growth rates exceeding 7.5% annually. Urban population expansion, projected to reach 1.5 billion by 2030, drives consumption of aerosol-based products. Investment in new manufacturing facilities has increased by 22%, while government incentives for sustainable packaging support industry expansion. Penetration rates in rural areas remain below 35%, indicating untapped potential. Increasing disposable income and lifestyle changes further enhance opportunities, supporting long-term aerosol can market insights.
Challenges in Asia Pacific Aerosol Cans Market
Supply Chain Volatility and Raw Material Costs
Supply chain disruptions and fluctuating raw material prices present challenges, with aluminium prices increasing by 14% and steel by 11% in recent years. Logistics costs have risen by 9%, impacting overall production expenses. Approximately 31% of manufacturers report delays in raw material procurement, affecting output consistency. Additionally, dependency on imports for specialised coatings and propellants creates vulnerabilities, particularly in Southeast Asia. These factors collectively challenge operational stability and influence the aerosol can market insights.
Report Scope
| Report Metric | Details |
|---|---|
| Market Size in 2025 | USD 11.10 Billion |
| Market Size in 2026 | USD 11.82 Billion |
| Market Size in 2034 | USD 19.64 Billion |
| CAGR | 6.52% (2026-2034) |
| Base Year for Estimation | 2025 |
| Historical Data | 2022-2024 |
| Forecast Period | 2026-2034 |
| Report Coverage | Revenue Forecast, Competitive Landscape, Supply Chain Disruption, Growth Factors, Environment & Regulatory Landscape and Trends |
Explore more data points, trends and opportunities Download Free Sample Report
Aerosol Cans Market Segmentation
The aerosol cans market is segmented based on type and application, with aluminium cans dominating at a 62.4% share, followed by steel at 33.1% and others at 4.5%. Personal care applications lead with a 41.8% share, followed by automotive & industrial at 29.5% and household at 28.7%, reflecting diversified demand patterns.
By Type
Aluminium accounts for over 62.4% of total production, exceeding 38 billion units annually. Their lightweight nature reduces transportation costs by 18%, while recyclability rates above 93% make them environmentally favourable. Pressure tolerance levels reach 8–10 bar, ensuring safety in high-demand applications. Increasing demand in personal care and household sectors drives production growth, with annual output rising by 6.3%.
Steel cans represent 33.1% share, with production volumes surpassing 20 billion units. They offer superior durability with pressure resistance exceeding 12 bar, making them suitable for industrial applications. Corrosion-resistant coatings improve lifespan by 25%, while cost efficiency makes them 15% cheaper than aluminum alternatives.
Other materials account for 4.5% share, producing around 3 billion units annually. These include hybrid and plastic-based cans with specialised coatings. Their usage is limited to aluminium 2% annually due to niche applications.
By Application
Personal care applications dominate with 41.8% share, consuming over 24 billion units annually. Products such as deodorants, hair sprays, and shaving foams drive demand, with usage penetration exceeding 72% in urban areas. Performance metrics include spray consistency above 95% and shelf life exceeding 24 months.
Household applications account for 28.7% share, with production exceeding 17 billion units. Cleaning sprays and air fresheners dominate, with adoption rates of 58% in urban households. Increased hygiene awareness has driven demand growth by 19% since 2022.
Automotive & industrial applications hold 29.5% share, consuming nearly 18 billion units. Products include lubricants, paints, and coatings, with industrial usage penetration at 54%. High-pressure tolerance and precision dispensing enhance efficiency.
Asia Pacific Aerosol Cans Market Segmentations
Type
- Aluminum Cans
- Steel Cans
- Others
Application
- Personal Care
- Household
- Automotive & Industrial
Asia Pacific Aerosol Cans Market Regional Outlook
China dominates with 46.3% share, producing over 27 billion units annually. Industrial and personal care sectors contribute 73% of total demand. Technological adoption rates exceed 78%, driving efficiency.
South Korea accounts for 8.7% share, producing 5 billion units annually. Advanced manufacturing technologies improve efficiency by 25%, while export-orientated production drives growth.
Japan holds 10.5% share, with production exceeding 6 billion units. High automation rates above 80% ensure consistent quality and low defect rates below 1%.
India contributes 9.2% share, producing 5.5 billion units. Rapid urbanisation and increasing disposable income drive demand growth at 7.8%.
Australia accounts for 4.3% share, with production of 2.6 billion units. Strong environmental regulations promote sustainable packaging.
Singapore holds a 2.1% share, producing 1.3 billion units, focusing on high-value exports.
Taiwan contributes a 3.4% share, with a production of 2 billion units, emphasising advanced coatings technology.
Southeast Asia collectively accounts for 15.5% share, producing over 9 billion units, driven by emerging economies.
Top players in Asia Pacific Aerosol Cans Market
- Ball Corporation
- Crown Holdings Inc.
- Ardagh Group
- CCL Industries
- Toyo Seikan Group
- CPMC Holdings
- Nampak Ltd.
- Trivium Packaging
- BWAY Corporation
- Mauser Packaging Solutions
- DS Containers
- Envases Group
Top Two Companies
-
Ball Corporation
-
Holds approximately 14.6% regional share
-
Strong presence in China and India with over 20 facilities
-
Focus on sustainable aluminum solutions with 95% recyclability rate
-
-
Crown Holdings Inc.
-
Commands around 12.3% share
-
Advanced manufacturing capabilities with production exceeding 8 billion units annually
-
Strong focus on innovation and lightweight can technology
-
Investment Analysis
Investment in the Asia Pacific aerosol can market exceeds 18% annual allocation towards capacity expansion and sustainability initiatives. The aluminium segment receives 54% of total investment, while steel accounts for 31% and others 15%. Regional investment distribution shows China attracting 42%, India 18%, and Southeast Asia 21%, reflecting growth potential. M&A activity has increased by 16%, with strategic partnerships focusing on eco-friendly technologies and automation upgrades. Collaboration between manufacturers and raw material suppliers has improved supply chain efficiency by 22%.
New Product Developments
New product developments account for 28% of total output, focusing on lightweight designs and eco-friendly coatings. Performance improvements include a 12% reduction in material usage and an 18% increase in durability. Innovations in spray technology enhance precision by 15%, while biodegradable propellants are gaining traction.
Recent Developments in Asia Pacific Aerosol Cans Market
- 2025: Production capacity increased by 9% with the addition of 3 billion units in China, enhancing regional supply stability.
- 2026: Investment in sustainable packaging technologies grew by 18%, supporting long-term industry growth.
Research Methodology
The research process involved a combination of primary and secondary research methodologies, analysing over 120 data sources and 45 industry interviews. Primary research included direct interactions with manufacturers, suppliers, and distributors, accounting for 62% of data validation. Secondary research involved reviewing company reports, industry publications, and government statistics, contributing 38% of insights. Market size estimation was conducted using a bottom-up approach, aggregating production data from over 350 companies, while cross-verification ensured accuracy within a ±3% margin. Data triangulation and statistical modelling were used to forecast trends from 2026 to 2034, ensuring comprehensive and reliable analysis.
Frequently Asked Questions
Senior Market Research Analyst | 8 Years Experience | Flexible Packaging, Biopolymers and Circular Systems
Christine specializes in flexible packaging formats, bio-based polymers, and circular packaging systems. She has authored 94+ reports for packaging converters, FMCG companies and material suppliers. Her expertise includes resin demand forecasting, lifecycle analysis, regulatory compliance tracking and supplier benchmarking across Europe.