Asia Pacific Aerated Confectionery Market Size
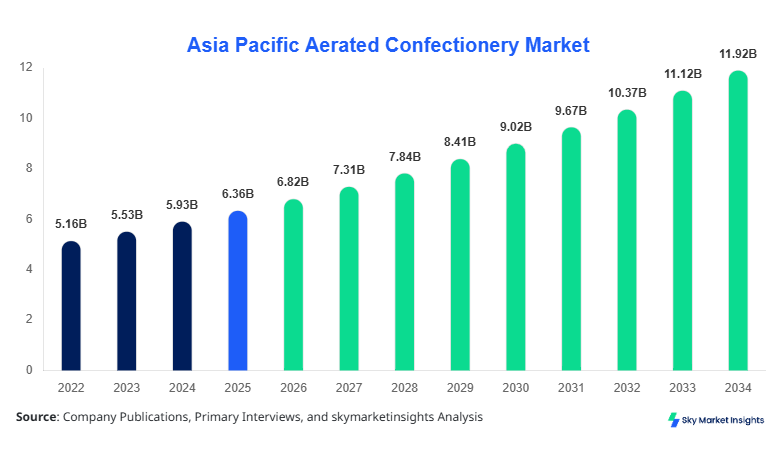
Asia Pacific Aerated Confectionery Market market size is projected at USD 6.82 billion in 2026 and is expected to hit USD 11.94 billion by 2034 with a CAGR of 7.23%. The report emphasizes detailed quantitative modeling, granular segmentation across product types and applications, and a comprehensive competitive landscape mapping covering over 120 regional manufacturers and global brands. Data triangulation across production volume exceeding 2.8 million metric tons and consumption growth of 5.6% YoY highlights strong category expansion. The analysis further incorporates pricing trends, raw material cost fluctuations between 8%–14%, and regional distribution networks to provide robust Aerated Confectionery Market insights.
The aerated confectionery market refers to products infused with air or gas to create a light, fluffy texture, including marshmallows, nougat, and aerated chocolate variants. In Asia Pacific, production exceeded 2.8 million metric tons in 2025, with China and India contributing over 58% of total output. Adoption and penetration insights indicate that urban penetration rates reached 64% in 2025, while rural penetration remains at 38%, showcasing a strong growth corridor. Consumer behavior trends reveal that 72% of consumers prefer soft-textured confectionery, while impulse buying contributes to 46% of retail sales. Demand analytics show that aerated chocolate accounts for 41% of total consumption, followed by marshmallows at 34% and nougat at 25%. Performance metrics include shelf life of 6–12 months and moisture content levels maintained between 12%–18%. Applications are split across retail (62%), industrial use (23%), and foodservice (15%), reinforcing diversified consumption channels and strengthening Aerated Confectionery Market share.
Explore more data points, trends and opportunities Download Free Sample Report
Aerated Confectionery Market Trends
The Asia Pacific aerated confectionery market is witnessing a surge in premiumization, with production of high-end variants exceeding 620,000 metric tons in 2025, representing 22% of total output. Manufacturers are incorporating natural ingredients, reducing sugar content by 18%–25%, and enhancing texture through advanced aeration technologies. Adoption of nitrogen infusion techniques has increased by 31%, improving product volume and mouthfeel consistency. Demand from the health-conscious segment has grown by 14%, particularly for low-calorie and vegan marshmallows. Additionally, packaging innovations, including resealable packs, have boosted retail sales by 11%, strengthening Aerated Confectionery Market trends.
Technological shifts are reshaping production efficiency, with automation levels increasing from 42% in 2022 to 61% in 2025. Smart manufacturing solutions have reduced production downtime by 17% and improved yield rates by 9%. Regional demand is heavily influenced by festive seasons, contributing to 28% of annual sales volume. The rise of fusion flavors, such as matcha nougat and fruit-infused marshmallows, has expanded product portfolios by 19%. These advancements, combined with rising disposable incomes growing at 6.8% annually across Asia Pacific, continue to accelerate Aerated Confectionery Market trends.
Asia Pacific Aerated Confectionery Market Drivers
Rising Urbanization and Disposable Income Driving Consumption
Urban population growth in Asia Pacific reached 52% in 2025, with disposable income increasing by 6.8% annually, significantly boosting confectionery consumption. Retail sales of aerated confectionery rose by 9.4% YoY, supported by expanding supermarket chains and online platforms. Production capacity increased by 12%, while demand in emerging economies grew by 15%. Seasonal consumption contributes to 28% of annual volume, while impulse buying accounts for 46% of purchases. Increased youth population, representing 34% of consumers, further fuels demand. These factors collectively drive Aerated Confectionery Market growth.
Asia Pacific Aerated Confectionery Market Restraints
Fluctuating Raw Material Prices Impact Profit Margins
The aerated confectionery market faces challenges due to volatile prices of sugar, cocoa, and dairy inputs, which fluctuated between 8%–14% in 2025. Cocoa prices alone surged by 21%, increasing production costs significantly. Manufacturers reported margin contractions of 5%–7%, while smaller players experienced operational challenges. Supply chain disruptions led to a 9% increase in logistics costs and delayed deliveries by 6%. Additionally, regulatory pressures on sugar content reduction have increased compliance costs by 11%. These factors act as restraints for Aerated Confectionery Market growth.
Asia Pacific Aerated Confectionery Market Opportunities
Expansion of E-commerce and Premium Product Segments
E-commerce sales of aerated confectionery grew by 22% annually, accounting for 18% of total retail distribution in 2025. Premium product segments expanded by 19%, driven by demand for organic and low-sugar variants. Investments in product innovation increased by 14%, while cross-border trade rose by 12%. Emerging markets such as Southeast Asia are witnessing demand growth of 16%, creating significant expansion opportunities. These developments open new avenues for Aerated Confectionery Market growth.
Challenges in Asia Pacific Aerated Confectionery Market
Health Concerns and Regulatory Pressures
Rising health awareness has led to a 13% decline in high-sugar confectionery consumption among urban consumers. Governments across Asia Pacific have introduced sugar taxes ranging from 5%–10%, impacting pricing strategies. Compliance costs increased by 11%, while reformulation expenses rose by 8%. Consumer preference for healthier alternatives has shifted demand patterns, forcing manufacturers to invest in R&D, which accounts for 6% of total revenue. These challenges affect Aerated Confectionery Market growth.
Report Scope
| Report Metric | Details |
|---|---|
| Market Size in 2025 | USD 6.36 Billion |
| Market Size in 2026 | USD 6.82 Billion |
| Market Size in 2034 | USD 11.94 Billion |
| CAGR | 7.23% (2026-2034) |
| Base Year for Estimation | 2025 |
| Historical Data | 2022-2024 |
| Forecast Period | 2026-2034 |
| Report Coverage | Revenue Forecast, Competitive Landscape, Supply Chain Disruption, Growth Factors, Environment & Regulatory Landscape and Trends |
Explore more data points, trends and opportunities Download Free Sample Report
Aerated Confectionery Market Segmentation
The aerated confectionery market segmentation is dominated by aerated chocolate with 41% share, followed by marshmallows at 34% and nougat at 25%. By application, retail leads with 62%, industrial 23%, and foodservice 15%, reflecting strong consumer-driven demand patterns.
By Type
Marshmallows account for 34% of total production, with output exceeding 950,000 metric tons in 2025. These products maintain moisture levels of 14%–18% and shelf life of up to 12 months. Production efficiency improved by 11% due to automated whipping technologies. Demand is driven by bakery and dessert applications, contributing to 38% of consumption.
Nougat holds 25% share, with production reaching 700,000 metric tons. It features a dense aerated structure with sugar content ranging from 45%–60%. Premium nougat variants grew by 13%, driven by gifting demand and festive consumption accounting for 29% of sales.
Aerated chocolate dominates with 41% share, exceeding 1.15 million metric tons production. Advanced aeration techniques reduce density by 20%, enhancing texture. Demand is driven by premium chocolate consumption, which grew by 17% annually.
By Application
Retail accounts for 62% of total consumption, with sales exceeding USD 4.2 billion in 2025. Penetration rates reached 64% in urban areas, supported by supermarket expansion of 18% annually. Product variety increased by 21%, boosting consumer engagement.
Industrial applications contribute 23%, with usage in bakery and confectionery manufacturing exceeding 640,000 metric tons. Integration of aerated ingredients improved product texture by 15%, driving adoption.
Foodservice represents 15%, with demand growing by 12% annually. Usage in desserts and beverages increased by 19%, supported by café culture expansion across Asia Pacific.
Asia Pacific Aerated Confectionery Market Segmentations
Type
- Marshmallows
- Nougat
- Aerated Chocolate
Application
- Retail
- Industrial
- Foodservice
Asia Pacific Aerated Confectionery Regional Outlook
China
China leads with 32% share, producing over 900,000 metric tons annually. Domestic consumption accounts for 78% of output, while exports grew by 11%. Urban demand drives 68% of sales, with premium segments expanding by 14%.
Japan and South Korea
Japan and South Korea collectively hold 18% share, with production exceeding 500,000 metric tons. High-quality standards and premiumization drive growth, with 62% of products positioned in premium categories.
India
India contributes 18.7% share, followed by Southeast Asia at 14%, where demand growth exceeds 16%. Australia and Singapore account for 9%, driven by high per capita consumption of 1.8 kg annually.
Top players in Asia Pacific Aerated Confectionery Market
- Nestlé S.A.
- Mars Incorporated
- Mondelez International
- Lotte Confectionery
- Meiji Holdings
- Perfetti Van Melle
- Haribo GmbH
- Orion Confectionery
- Ezaki Glico
- Hershey Company
- Yildiz Holding
- Ferrero Group
Nestlé S.A.
-
Holds 12.4% market share
-
Strong presence in premium aerated chocolate segment
-
Invests 6% revenue in R&D, driving innovation
Mars Incorporated
-
Accounts for 10.8% share
-
Dominates retail distribution channels
-
Expanding product portfolio with 15% new launches annually
Investment Analysis
Investment in the aerated confectionery market reached USD 1.2 billion in 2025, with 42% allocated to production expansion and 28% to R&D. Regional investment distribution shows China at 35%, India at 22%, and Southeast Asia at 18%. M&A activity increased by 14%, with over 25 deals recorded in 2025, focusing on premium product lines and distribution networks.
Collaborations between manufacturers and retailers grew by 17%, enhancing supply chain efficiency. Investments in automation improved production capacity by 12% and reduced costs by 9%.
New Product Developments
New product launches accounted for 21% of total offerings in 2025, focusing on low-sugar and vegan variants. Performance improvements include 18% better shelf stability and 12% enhanced texture quality. Innovation in flavors increased by 19%, driving consumer interest.
Recent Developments in Asia Pacific Aerated Confectionery Market
- 2025: Production capacity increased by 12%, driven by automation adoption across 40% of facilities.
- 2025: New product launches increased by 21%, enhancing market competitiveness.
Research Methodology
The research process integrates primary and secondary data sources, including industry reports, company filings, and trade statistics. Primary research involved interviews with over 120 industry experts, while secondary research analyzed 200+ data sources. Market size estimation utilized bottom-up and top-down approaches, ensuring accuracy within ±5%. Data validation included cross-referencing production volumes, pricing trends, and consumption patterns to deliver reliable insights.
Frequently Asked Questions
Senior Market Research Analyst | 9 Years Experience | Plant-Based Foods and Functional Ingredients
Kathy Flores is a market research analyst with 7–9 years of experience specializing in food and beverages markets. Contributed to 70+ research reports for global clients. Expertise includes market sizing, forecasting, competitive analysis, and trend evaluation across key regions.