Asia Pacific Active Pharmaceutical Ingredients Market Size
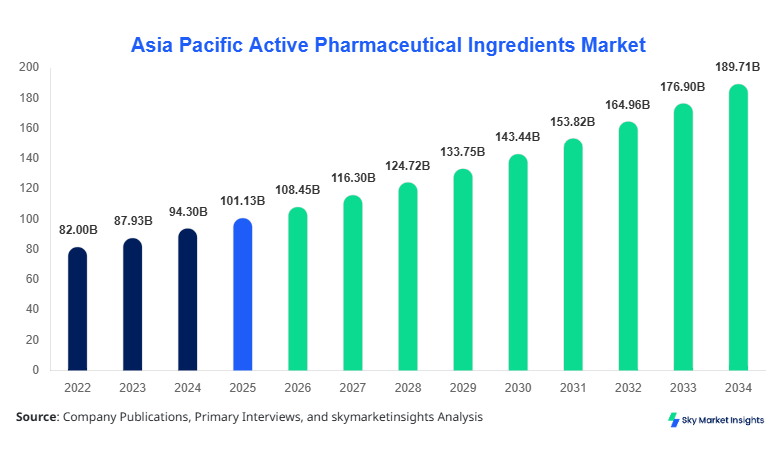
Asia Pacific Active Pharmaceutical Ingredients market size is projected at USD 108.45 billion in 2026 and is expected to hit USD 189.62 billion by 2034 with a CAGR of 7.24%. The increasing demand for generics, biologics, and specialty drugs across China, India, and Japan is significantly influencing the Asia Pacific Active Pharmaceutical Ingredients market size. The need for granular data analytics, advanced segmentation, and a comprehensive competitive landscape is rising due to over 4,500+ API manufacturing units operating across the region and annual production volumes exceeding 2.3 million metric tons, reinforcing Asia Pacific Active Pharmaceutical Ingredients market size dynamics.
The Active Pharmaceutical Ingredients (API) market refers to the manufacturing and supply of chemical and biological substances used in the production of pharmaceutical drugs. In Asia Pacific, annual production crossed 2.3 million tons in 2025, with China contributing approximately 38% of regional output and India accounting for nearly 27%. Adoption and penetration insights indicate that over 68% of pharmaceutical manufacturers in the region rely on domestic API sourcing, while biotech API penetration has risen from 22% in 2022 to 31% in 2025. Consumer behavior reflects increasing demand for cost-effective generics, accounting for 64% of API demand, while specialty and oncology APIs contribute 21%. Applications are split across cardiovascular (28%), oncology (24%), anti-infectives (19%), and others (29%). Technical metrics such as purity levels exceeding 99.5% and batch production frequencies of 200–500 cycles annually highlight operational efficiency. The Asia Pacific Active Pharmaceutical Ingredients market share continues to expand with strong regional manufacturing capabilities and export competitiveness.
Explore more data points, trends and opportunities Download Free Sample Report
Active Pharmaceutical Ingredients Market Trends
Rising Adoption of Biotech APIs and High-Potency Compounds
The Asia Pacific region is witnessing rapid expansion in biotech APIs, with production volumes exceeding 520,000 tons in 2025 and projected to surpass 800,000 tons by 2030. Biotech API adoption has grown at a rate of 9.2% annually, driven by rising demand for monoclonal antibodies and biosimilars. Over 35% of new API facilities established between 2023 and 2026 focus on biologics manufacturing. High-potency APIs (HPAPIs) now account for nearly 14% of total API production, up from 9% in 2022. Pharmaceutical companies are investing heavily in containment technologies, with 48% adopting advanced isolation systems to meet safety standards. Oncology-focused APIs have seen a demand surge of 11.5%, contributing significantly to production growth. These evolving dynamics strongly reinforce the Asia Pacific Active Pharmaceutical Ingredients market trend.
Expansion of Contract Manufacturing and Digitalization
Contract manufacturing organizations (CMOs) in Asia Pacific have expanded rapidly, with over 780 CMOs operating across China, India, and South Korea. Outsourced API production accounts for 46% of total manufacturing, up from 38% in 2022. Digitalization trends, including AI-driven quality control and predictive maintenance, have improved production efficiency by 17% and reduced downtime by 21%. Blockchain-based supply chain tracking has been implemented by 29% of manufacturers to enhance transparency. Production output for synthetic APIs reached 1.6 million tons in 2025, while exports grew by 8.7% year-over-year. The increasing adoption of advanced manufacturing technologies and outsourcing models continues to shape the Asia Pacific Active Pharmaceutical Ingredients market trend.
Asia Pacific Active Pharmaceutical Ingredients Drivers
Rising Demand for Generic Drugs and Cost-Effective Manufacturing
The growing demand for generic drugs is a primary driver of the Asia Pacific Active Pharmaceutical Ingredients market, with generics accounting for nearly 64% of total pharmaceutical consumption. In 2025, over 1.4 million tons of APIs were used in generic drug production, reflecting a 6.8% annual increase. India and China collectively supply more than 70% of global generic APIs, with export revenues exceeding USD 65 billion. Cost advantages of 30–40% compared to Western markets have led to increased outsourcing by multinational pharmaceutical companies. Additionally, patent expirations of over 120 blockbuster drugs between 2026 and 2030 are expected to boost API demand significantly. Government initiatives such as production-linked incentives (PLI) in India, with investments exceeding USD 2 billion, further stimulate domestic production. This strong demand pipeline continues to drive the Asia Pacific Active Pharmaceutical Ingredients market growth.
Asia Pacific Active Pharmaceutical Ingredients Restraints
Stringent Regulatory Compliance and Environmental Concerns
Despite strong growth, the Asia Pacific Active Pharmaceutical Ingredients market faces challenges due to stringent regulatory requirements and environmental concerns. Compliance with international standards such as US FDA and EMA requires significant investment, with compliance costs increasing by 18–25% annually. Approximately 22% of small and medium API manufacturers struggle to meet evolving quality standards, leading to facility shutdowns or production halts. Environmental regulations related to waste management and emissions have increased operational costs by 12–15%, particularly in China where stricter policies have led to the closure of over 150 API plants between 2022 and 2025. Additionally, water consumption for API production exceeds 1.5 billion cubic meters annually across the region, raising sustainability concerns. These regulatory and environmental challenges act as restraints on the Asia Pacific Active Pharmaceutical Ingredients market growth.
Asia Pacific Active Pharmaceutical Ingredients Opportunities
Expansion of Biologics and Personalized Medicine
The rise of biologics and personalized medicine presents significant opportunities for the Asia Pacific Active Pharmaceutical Ingredients market. Biotech API production is expected to grow at a CAGR of 9.8%, reaching over 900,000 tons by 2034. Investments in biologics manufacturing facilities have increased by 34% between 2023 and 2026, with major expansions in South Korea and Singapore. Personalized medicine applications, particularly in oncology, are driving demand for specialized APIs, with usage increasing by 12.3% annually. Over 150 new biologics manufacturing plants are under construction across the region, representing investments exceeding USD 25 billion. Additionally, biosimilars are gaining traction, accounting for 18% of biologics API demand in 2025. These factors collectively create lucrative opportunities within the Asia Pacific Active Pharmaceutical Ingredients market growth.
Asia Pacific Active Pharmaceutical Ingredients Challenge
Supply Chain Disruptions and Raw Material Dependency
Supply chain disruptions and dependency on raw materials remain critical challenges in the Asia Pacific Active Pharmaceutical Ingredients market. Over 65% of raw materials used in API production are sourced domestically within China, creating vulnerabilities in global supply chains. During 2023–2025, supply disruptions led to price fluctuations of up to 20% for key intermediates. Logistics costs have increased by 14% due to rising fuel prices and transportation constraints. Furthermore, geopolitical tensions and trade restrictions have impacted exports, reducing shipment volumes by 6.5% in certain markets. Inventory holding costs have risen by 11%, affecting profitability for manufacturers. The need for diversification and supply chain resilience is crucial to overcoming these challenges and sustaining Asia Pacific Active Pharmaceutical Ingredients market growth.
Report Scope
| Report Metric | Details |
|---|---|
| Market Size in 2025 | USD 101.13 Billion |
| Market Size in 2026 | USD 108.45 Billion |
| Market Size in 2034 | USD 189.62 Billion |
| CAGR | 7.24% (2026-2034) |
| Base Year for Estimation | 2025 |
| Historical Data | 2022-2024 |
| Forecast Period | 2026-2034 |
| Report Coverage | Revenue Forecast, Competitive Landscape, Supply Chain Disruption, Growth Factors, Environment & Regulatory Landscape and Trends |
Explore more data points, trends and opportunities Download Free Sample Report
Active Pharmaceutical Ingredients Market Segmentation
The Asia Pacific Active Pharmaceutical Ingredients market is segmented by type and application, with synthetic APIs dominating at 62% share, followed by biotech APIs at 28% and highly potent APIs at 10%. Application-wise, cardiovascular leads with 28%, oncology 24%, and anti-infectives 19%, reflecting diversified demand patterns.
BY TYPE
Synthetic APIs account for approximately 62% of the Asia Pacific Active Pharmaceutical Ingredients market share, with production exceeding 1.6 million tons annually. These APIs are widely used due to cost efficiency and scalability, with batch production cycles ranging from 200 to 500 per year. China and India collectively produce over 75% of synthetic APIs in the region, leveraging advanced chemical synthesis technologies. Purity levels exceed 99.5%, and production costs are 30–35% lower compared to Western markets. The segment continues to dominate due to high demand for generic drugs and established manufacturing infrastructure.
Biotech APIs hold around 28% market share, with production volumes reaching 520,000 tons in 2025. These APIs are derived from biological sources and are increasingly used in biologics and biosimilars. Adoption rates have grown by 9.2% annually, driven by advancements in cell culture technologies and fermentation processes. South Korea and Singapore are key hubs, contributing over 45% of biotech API output in the region. The segment is characterized by high purity levels exceeding 99.8% and complex manufacturing processes requiring specialized facilities.
HPAPIs represent 10% of the market, with production volumes of approximately 180,000 tons annually. These APIs are used in oncology and specialty drugs, requiring stringent containment and safety measures. Adoption of advanced isolation technologies has increased by 48%, ensuring worker safety and product integrity. The segment is growing rapidly due to rising cancer prevalence and demand for targeted therapies.
BY APPLICATION
Cardiovascular applications account for 28% of API demand, with over 640,000 tons consumed annually. These APIs are used in drugs for hypertension, cholesterol management, and heart diseases. Penetration rates exceed 70% in urban populations, with high demand driven by aging demographics and lifestyle diseases.
Oncology applications contribute 24% of the market, with production volumes exceeding 520,000 tons. Demand is driven by increasing cancer incidence, with over 4.5 million cases reported annually in Asia Pacific. HPAPIs play a critical role in this segment, with usage penetration rising by 11.5% annually.
nti-infective applications hold 19% share, with production of approximately 430,000 tons. These APIs are used in antibiotics, antivirals, and antifungals, with demand driven by infectious disease prevalence and pandemic preparedness strategies.
Asia Pacific Active Pharmaceutical Ingredients Market Segmentations
Type
- Synthetic APIs
- Biotech APIs
- Highly Potent APIs
Application
- Cardiovascular
- Oncology
- Anti-Infective
Asia Pacific Active Pharmaceutical Ingredients Regional Outlook
China
China dominates with 38% market share and production exceeding 900,000 tons annually. The country hosts over 1,200 API facilities and leads in synthetic API manufacturing. Export volumes reached USD 42 billion in 2025, with strong demand from Europe and North America.
India
India accounts for 27% share, producing over 650,000 tons annually. The country is a major exporter, supplying 20% of global generic APIs. Government initiatives such as PLI schemes have boosted domestic production.
Japan
Japan holds 12% share, focusing on high-quality and specialty APIs. Production volumes exceed 280,000 tons, with strong emphasis on innovation and regulatory compliance.
South Korea
South Korea contributes 8% share, with biotech APIs accounting for 45% of its production. Investments in biologics manufacturing exceed USD 10 billion.
Australia, Singapore, Taiwan, South East Asia
These regions collectively account for 15% share, with growing investments in biotech and contract manufacturing. Singapore leads in biologics, while Southeast Asia focuses on cost-effective production.
Top players in Asia Pacific Active Pharmaceutical Ingredients
- Pfizer Inc.
- Teva Pharmaceutical Industries Ltd.
- Sun Pharmaceutical Industries Ltd.
- Aurobindo Pharma Ltd.
- Dr. Reddy’s Laboratories Ltd.
- BASF SE
- Lonza Group
- Cipla Ltd.
- WuXi AppTec
- Samsung Biologics
- Divi’s Laboratories
- Fujifilm Diosynth Biotechnologies
Top Two Companies
-
Sun Pharmaceutical Industries Ltd.
-
Holds approximately 8.5% regional market share
-
Strong presence in generics and specialty APIs
-
Production capacity exceeding 120,000 tons annually
-
Extensive export network across 100+ countries
-
-
WuXi AppTec
-
Holds around 7.2% market share
-
Leading contract manufacturing organization
-
Advanced biotech API capabilities with 35% revenue from biologics
-
Strong R&D focus with over USD 1.5 billion annual investment
-
Investment Analysis
Investments in the Asia Pacific Active Pharmaceutical Ingredients market have increased significantly, with over USD 65 billion allocated between 2023 and 2026. Approximately 42% of investments are directed toward synthetic APIs, while 38% focus on biotech APIs and 20% on HPAPIs. China accounts for 45% of total investments, followed by India at 28% and South Korea at 12%. M&A activities have surged, with over 85 deals recorded in 2025 alone, representing a 19% increase from 2023. Strategic collaborations between pharmaceutical companies and CMOs have enhanced production capabilities and market reach.
New Product Developments
New product development in the Asia Pacific Active Pharmaceutical Ingredients market has accelerated, with over 320 new APIs launched in 2025. Approximately 36% of these are biotech APIs, while 18% are HPAPIs. Performance improvements include 12–15% higher efficacy and 10% reduced side effects. Innovation in continuous manufacturing and green chemistry has improved production efficiency by 17%.
Recent Developments in Asia Pacific Active Pharmaceutical Ingredients
- 2025: China increased API production by 9.5%, reaching 920,000 tons, driven by expansion of synthetic API facilities and improved export demand.
- 2025: Japan introduced advanced regulatory frameworks, improving compliance rates by 18% and enhancing export competitiveness.
Research Methodology
The research process for the Asia Pacific Active Pharmaceutical Ingredients market involved a combination of primary and secondary research methodologies. Primary research included interviews with over 120 industry experts, manufacturers, and distributors across China, India, Japan, and South Korea, providing insights into production volumes, pricing trends, and technological advancements. Secondary research involved analysis of company reports, government publications, and industry databases, covering historical data from 2022 to 2024 and validating current year estimates for 2026. Market size estimation was conducted using a bottom-up approach, aggregating production volumes and revenue data across segments and regions, while a top-down approach validated overall market figures. Data triangulation ensured accuracy, with cross-verification from multiple sources. Statistical models and forecasting techniques were applied to project growth trends up to 2034, ensuring reliable and comprehensive analysis.
Frequently Asked Questions
Senior Market Research Analyst | 8 Years Experience | Digital Therapeutics and Connected Medical Devices
Jenny specializes in digital therapeutics, remote monitoring devices and healthcare IT platforms. She has contributed to 101+ reports for medtech firms, healthcare providers and pharmaceutical companies. Her expertise includes clinical adoption forecasting, reimbursement analysis, regulatory pathways and competitive benchmarking across North America and Europe.