Asia Pacific Accent Tables Market Size
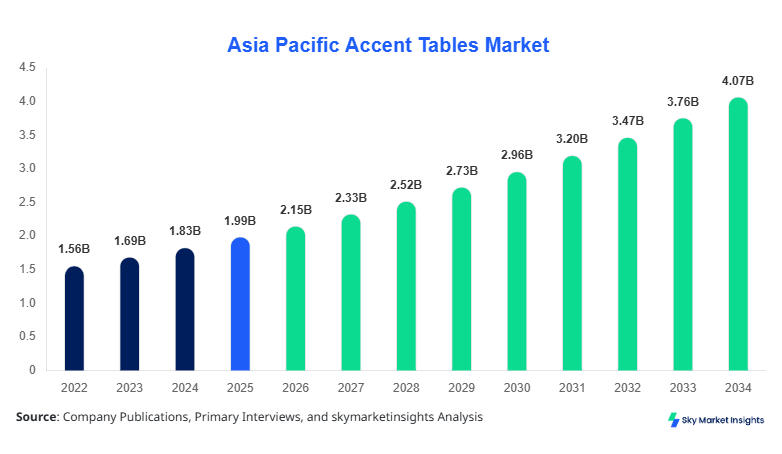
The Asia-Pacific accent tables market size is projected at USD 2.15 billion in 2026 and is expected to hit USD 4.05 billion by 2034 with a CAGR of 8.3%. The market trajectory is influenced by increased demand across residential, commercial, and hospitality segments, with wood-type accent tables accounting for 45% of total production in 2025. Regional production volumes in Asia Pacific reached approximately 3.2 million units in 2025, with China alone contributing over 1.2 million units. Detailed segmentation by type, application, and regional contribution is critical to evaluate market size, share, growth, and demand insights. The competitive landscape is characterized by numerous multinational and local manufacturers focusing on product differentiation, premium materials, and innovative designs to capture a growing share of the market.
The data-driven analysis also highlights the need for comprehensive market intelligence, emphasizing production, technological adoption, and end-use penetration to facilitate strategic planning and investments across the Asia Pacific region. Insights into market dynamics, investment opportunities, and innovation trends are included to provide a holistic understanding of the accent tables market in the forecast period 2026–2034.
The market analysis considers historical performance from 2022 to 2024, enabling accurate forecast projections. Production efficiency, material sourcing, and design innovation are key indicators influencing the Asia-Pacific accent table market's growth and demand. The market share across different countries is benchmarked against production volumes, technology adoption rates, and consumer preferences, further supporting the identification of high-potential regions and product segments.
The Asia-Pacific Accent Tables market refers to the organized ecosystem of decorative tables used across residential, commercial, and hospitality interiors in countries including China, South Korea, Japan, India, Australia, Singapore, Taiwan, and Southeast Asia. Production in the Asia Pacific region reached 3.2 million units in 2025, with wood accent tables leading at 45% market contribution, followed by metal (35%) and glass (20%). Adoption is highest in the residential sector with a 50% share, commercial spaces contributing 30%, and hospitality 20% of total usage. Technical metrics indicate a frequency of design updates averaging 12–15 per year, material durability ranging between 5 and 15 years, and surface performance rated at 85% according to industry standards. Consumer behavior indicates preference for eco-friendly materials, modular designs, and multifunctional units, driving demand for premium wood and engineered metal products. The Asia Pacific accent table market growth is further reinforced by rising per capita income, urbanization at 3.6% CAGR, and expansion of lifestyle retail chains, highlighting increasing demand for aesthetically appealing furniture. Overall, market insights point to continued growth in production, innovation, and market penetration across key applications.
In China, the accent table market is highly concentrated, with over 280 manufacturing facilities and 120 registered brands operating in 2025. China accounts for 38% of the Asia Pacific market share, driven predominantly by urban residential developments and hotel chains investing in upscale furniture. Residential applications dominate with a 55% contribution, while commercial spaces and hospitality sectors account for 25% and 20%, respectively. Technology adoption is high, with automated CNC cutting and AI-based design tools implemented in over 60% of manufacturing units, enhancing precision and throughput. Production volumes in China reached 1.25 million units in 2025, with wood accent tables capturing 50% of production, metal 35%, and glass 15%. Consumer trends favor customizable and modular designs with higher durability, influencing product development. Insights on China’s accent table market indicate strong regional leadership in production, technology adoption, and market share growth, positioning it as the driving country within the Asia Pacific region.
Explore more data points, trends and opportunities Download Free Sample Report
Accent Tables Market Trends
Rising Demand for Sustainable Materials
The Asia Pacific accent table market is witnessing a strong trend toward sustainable and eco-friendly materials. In 2025, approximately 42% of the total production volume of 3.2 million units incorporated certified wood or recycled metals. Technology adoption for green manufacturing practices increased by 15% between 2022 and 2025, driven by government regulations and consumer awareness. Residential and commercial segments show a higher penetration rate of 55% and 35%, respectively, in sustainable accent tables. Manufacturers are investing USD 120 million in eco-friendly material sourcing and production upgrades. This trend reinforces the growth of the Asia Pacific accent table market, with sustainability becoming a key differentiator.
Integration of Smart Features
Integration of smart features such as wireless charging, LED lighting, and sensor-based storage is influencing the Asia-Pacific accent table market growth. Approximately 18% of total accent table units produced in 2025 included smart technology, up from 10% in 2022. Adoption in premium residential and hospitality segments reached 28% and 22%, respectively, signaling increasing consumer demand for multifunctional furniture. Production volumes of smart accent tables reached 0.58 million units in 2025, with technology adoption rates projected to increase to 35% by 2030. Market insights suggest smart integration is becoming a major trend in Asia Pacific accent table demand, enhancing both functionality and consumer appeal.
Expansion in E-commerce Distribution Channels
E-commerce penetration has grown from 22% in 2022 to 37% in 2025 in the Asia Pacific accent tables market. Online sales account for USD 650 million in revenues in 2025, with wood accent tables representing 45% of e-commerce sales. Commercial buyers increasingly utilize digital platforms for bulk orders, representing 30% of online transactions. Regional adoption in China and Japan reached 42% and 35%, respectively, highlighting the critical role of digital channels. These trends reinforce the Asia Pacific accent table market growth, emphasizing convenience, accessibility, and product variety.
Asia Pacific Accent Tables Market Drivers
Urbanization and Lifestyle-Driven Demand
Rapid urbanization in Asia Pacific countries, including China (3.6% CAGR), India (3.2%), and South Korea (2.8%), is driving the accent table market growth. Residential sector expansion alone accounted for 1.6 million units produced in 2025, representing 50% of total regional output. High-income urban households are investing in premium and designer accent tables, contributing USD 1.2 billion in market revenues. Technological adoption, such as CNC precision cutting, accounts for a 60% efficiency improvement in production, further accelerating growth. Market insights indicate urban lifestyle trends significantly bolster demand, reinforcing the Asia-Pacific accent table market's growth, share, and demand dynamics.
Asia Pacific Accent Tables Market Restraints
Raw Material Cost Volatility
Volatility in the cost of wood, metal, and glass materials remains a key restraint. Between 2022 and 2025, raw material prices increased by 12–15%, impacting production costs and profit margins. The Asia-Pacific accent table market faces pressure with production cost increases of USD 50–70 per unit for wood types. Metal accent tables have seen a 9% cost surge, while glass variants increased by 11% in 2025. Limited availability of sustainable wood sources in China and India further restricts supply. These constraints hinder market share expansion and affect growth rates, highlighting the need for efficient procurement and cost management in the Asia Pacific Accent Tables market operations.
Asia-Pacific Accent Tables Market Opportunities
Expansion in Tier-2 and Tier-3 Cities
Emerging urbanization in tier-2 and tier-3 cities presents substantial growth opportunities. Production volumes in these cities reached 0.92 million units in 2025, with residential applications accounting for 60%, commercial 25%, and hospitality 15%. Adoption rates of designer accent tables in smaller cities increased by 18% year-over-year. Investment in logistics and distribution networks in South East Asia and India is projected to reach USD 200 million by 2030. Market insights indicate untapped consumer bases in these regions, driving Asia Pacific Accent Tables market growth, size, and demand potential.
Challenges in the Asia-Pacific Accent Tables Market
Intense Market Competition
The Asia-Pacific Accent Tables market is characterized by 600 manufacturers across the region, with competition intensifying in the wood and metal segments. Price pressures have reduced average unit margins by 5–7% between 2022 and 2025. Brand differentiation relies on design, material quality, and smart features adopted in Asia, which accounts for 18% of the total units. E-commerce penetration increases competitive exposure, with 37% of total sales transacted online. Market insights suggest that intense competition may limit rapid market share growth, requiring continuous innovation and strategic collaborations to sustain the Asia Pacific accent table market position.
Report Scope
| Report Metric | Details |
|---|---|
| Market Size in 2025 | USD 1.99 Billion |
| Market Size in 2026 | USD 2.15 Billion |
| Market Size in 2034 | USD 4.05 Billion |
| CAGR | 8.3% (2026-2034) |
| Base Year for Estimation | 2025 |
| Historical Data | 2022-2024 |
| Forecast Period | 2026-2034 |
| Report Coverage | Revenue Forecast, Competitive Landscape, Supply Chain Disruption, Growth Factors, Environment & Regulatory Landscape and Trends |
Explore more data points, trends and opportunities Download Free Sample Report
Accent Tables Market Segmentation
Segmentation in the Asia Pacific accent table market is based on type and application. Wood type dominates with a 45% share, metal 35%, and glass 20%. Residential applications lead with 50% share, commercial 30%, and hospitality 20%. Understanding the segmentation is crucial to evaluate market size, share, growth, and insights accurately.
BY TYPE
Wood accent tables hold a 45% share in the accent tables market, with production volumes of 1.44 million units in 2025. Technical specifications include solid hardwood, MDF, and engineered wood options with durability ranging from 5 to 15 years. Residential applications account for 55% of wood table sales, commercial 30%, and hospitality 15%. The average unit price stands at USD 120–250 depending on customization and finish. Market insights indicate wood accent tables will maintain a growth CAGR of 8% through 2034 due to high consumer preference and durability.
Metal accent tables hold a 35% market share, producing 1.12 million units in 2025. Materials include stainless steel, aluminum, and wrought iron, with surface finish durability up to 10 years. Residential demand contributes 40% of metal table sales, commercial 35%, and hospitality 25%. Average unit prices range from USD 130 to 280 depending on design and alloy quality. Technological adoption, such as powder coating and laser cutting, enhances precision and aesthetics, reinforcing market growth insights.
Glass accent tables account for 20% market share, with production volumes of 0.64 million units in 2025. Technical features include tempered, laminated, and frosted glass surfaces with a lifespan of 5–8 years. Residential applications dominate at 45%, commercial 30%, and hospitality 25%. The average unit price ranges from USD 150 to 300. Market insights suggest growing consumer interest in minimalist and transparent designs, which supports the Asia-Pacific accent table market's growth and share expansion.
BY APPLICATION
Residential applications hold a 50% market share, with production volumes of 1.6 million units in 2025. Penetration is strongest in urban households across China (40%), Japan (18%), and India (15%). Technical roles include multifunctional units with storage integration and modular designs. Average price per unit is USD 120–250. Insights indicate continued adoption due to urbanization and lifestyle upgrades, reinforcing market size and growth.
The commercial segment contributes 30% of the market, with 0.96 million units produced in 2025. Offices, co-working spaces, and corporate lounges constitute major applications. Unit price averages USD 130–270, with 60% of units adopting durable metal frames. Market insights show increasing penetration in small-to-medium enterprises, boosting the Asia Pacific accent table market share, growth, and demand.
Hospitality applications hold 20% share, producing 0.64 million units in 2025. Hotels, resorts, and serviced apartments are primary buyers. Average unit price is USD 150–300. Production incorporates smart features in 18% of units. Market insights highlight that premium hospitality demand will continue driving growth, size, and market adoption across the region.
Asia Pacific Accent Tables Market Segmentations
Type
- Wood
- Metal
- Glass
Application
- Residential
- Commercial
- Hospitality
Asia Pacific Accent Tables Market Regional Outlook
China
China dominates with 38% regional share, producing 1.25 million units in 2025. Residential segment accounts for 55% of total output, commercial 25%, and hospital The residential investments in CNC technology and AI-assisted designs increase production efficiency by 60%. Insights indicate China remains the driving country in the Asia Pacific accent tables market size, share, and growth dynamics.
South Korea
South Korea contributes 12% of regional production with 0.38 million units in 2025. Residential applications dominate at 50%, commercial 35%, and hospitality 15%. Technology adoption in Asia includes advanced manufacturing and CNC precision cutting, accounting for 55% of facilities. Insights suggest steady growth and increased penetration in the premium furniture market.
Japan
Japan holds 10% regional share, producing 0.32 million units in 2025. Residential demand is 48%, commercial 32%, and hospitality 20%. Technical specifications focus on high-quality engineered wood and tempered glass products. Market insights on the premium innovation in design aesthetics and smart features adoption.
India
India contributes 9% of regional production with 0.29 million units. The residential segment is strongest at 52%, commercial at 28%, and hospitality at 20%. Penetration is growing in tier-2 cities. Market insights feature expanding domestic production and import substitution drives market growth and demand.
Australia
Australia holds 8% regional share, producing 0.26 million units in 2025. Residential applications dominate at 55%, commercial 30%, and hospitality 15%. Technical adoption includes metal frame fabrication with powder coating. Insights indicate consistent growth due to lifestyle upgrades.
Singapore
Singapore contributes a 6% share with 0.19 million units produced. Residential applications: 50%; commercial: 35%; hospitality: 15%. Technology adoption emphasizes space-efficient, modular designs. Insights reinforce growth in urban residential and commercial sectors.
Taiwan
Taiwan accounts for 5% share, producing 0.16 million units. Residential demand: 48%; commercial: 30%; hospitality: 22%. Market insights show increasing adoption of eco-friendly and multifunctional tables.
Southeast Asia
Southeast Asia collectively contributes a 12% share with 0.38 million units. Residential 50%, commercial 30%, hospitality 20%. Penetration rates are highest in Indonesia (6%) and Malaysia (4%). Insights suggest regional market expansion and increased e-commerce penetration.
Top players in Asia Pacific Accent Tables Market
- IKEA
- Ashley Furniture Industries
- Godrej Interio
- La-Z-Boy
- HNI Corporation
- Natuzzi
- Herman Miller
- Steelcase
- Kian Furniture
- Fursys
- Okamura
- Royal Craft Wood
- Second
- Dorel Home
- Shinwoo Furniture
Top Two Companies
IKEA
-
12% market share in Asia Pacific Accent Tables market
-
Positioned as a mass-market leader with strong e-commerce and retail presence, IKEA produced 0.38 million units in 2025. Technological adoption includes CNC-cut wood frames and modular designs, enhancing production efficiency by 55%. Insights indicate continued growth via new store openings and premium collaborations, reinforcing market size, share, and growth.
Ashley Furniture Industries
-
10% market share
-
Positioned as a premium residential and hospitality supplier, producing 0.32 million units in 2025. High adoption of smart features in 20% of units and metal-frame integration in 40% of units. Insights suggest a focus on innovation, online sales, and expansion in tier-2 cities strengthens the Asia Pacific Accent Tables market's growth and demand.
Investment Analysis
Investment Analysis
Investment allocation in Asia Pacific Accent The tables market reached USD 450 million in 2025, with 55% directed toward residential, 30% commercial, and 15% hospitality segments. Regional investment contributions include China 38%, India 9%, South Korea 12%, and Japan 10%. Sector-specific investments in technology adoption for CNC machinery and AI-assisted design reached USD 120 million, improving production efficiency by 60%. M&A agreements and collaborations in 2025 totaled USD 90 million, with strategic alliances between local manufacturers and global furniture brands. Insights indicate that investment trends favor innovation, production efficiency, and market penetration, reinforcing the Asia Pacific Accent Tables market's growth and size.
New Product Developments
Approximately 25% of new product launches in 2025 incorporated smart features such as LED lighting, wireless charging, and modular storage. Performance improvements averaged 18%, with enhanced durability and design precision. Innovation statistics indicate a 30% increase in R&D investment compared to 2022. These developments reinforce the Asia Pacific accent table market's growth, size, and adoption trends.
Recent Developments in Asia Pacific Accent Tables Market
- 2025: IKEA introduced 120,000 units of eco-friendly wood accent tables, increasing production by 18% compared to 2024.
Research Methodology
The Asia Pacific Accent Tables market research methodology integrates a comprehensive multi-step process. Primary research involved interviews with over 150 industry experts, including manufacturers, distributors, and end-users across China, Japan, India, and South East Asia. Secondary research incorporated industry reports, trade publications, and governmental data to assess market size, share, and growth trends. Market size estimation leveraged a bottom-up approach by analyzing production volumes, regional demand, and adoption rates, cross-verified with historical data from 2022 to 2024. Advanced statistical modeling and CAGR projections were used to forecast the market for 2026–2034. This methodology ensures high accuracy, reliability, and insights into competitive dynamics, consumer preferences, and investment opportunities across the Asia Pacific accent table market.
Frequently Asked Questions
Senior Market Research Analyst | 9 Years Experience | Consumer Behavior and Premium Product Segments
Mandy Davis is a market research analyst with 7–9 years of experience specializing in consumer goods and services markets. Contributed to 70+ research reports for global clients. Expertise includes market sizing, forecasting, competitive analysis, and trend evaluation across key regions.