United States Alternative Sweeteners Market Size
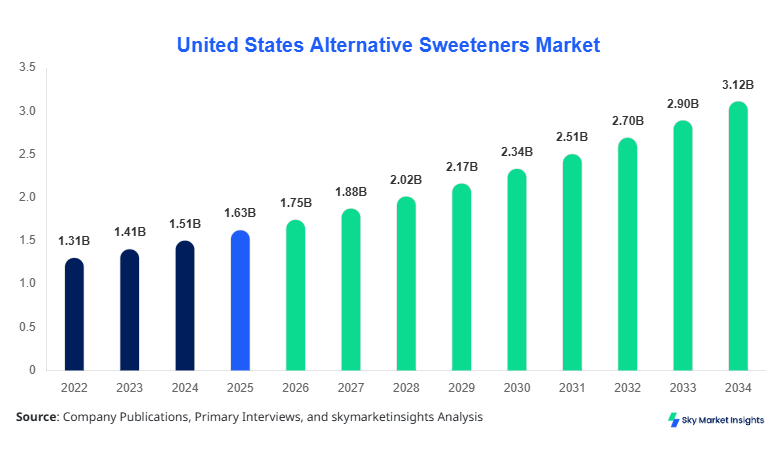
United States Alternative Sweeteners market size is projected at USD 1.75 billion in 2026 and is expected to hit USD 3.24 billion by 2034 with a CAGR of 7.5%. The market demand is driven by increasing health-conscious consumers and regulatory push for sugar reduction in foods and beverages. Comprehensive data on production volumes, consumption patterns, and competitive landscape is necessary for stakeholders to make informed decisions. Market segmentation by type and application, coupled with detailed analysis of top players, helps identify opportunities and trends. Advanced insights into technological adoption, pricing strategies, and market penetration will provide actionable intelligence for investors and manufacturers in the United States Alternative Sweeteners market.
The report leverages historical data (2022–2024), the current year (2026), and projected forecast (2026–2034) to present a holistic market view. Regional demand, facility numbers, production capacity, and application-specific consumption metrics are analyzed to support strategic planning and business development.
United States Alternative Sweeteners market insights highlight the increasing preference for natural sweeteners, the rise in low-calorie food and beverage launches, and the technological evolution in extraction and formulation processes. This report emphasizes production trends, type-wise adoption, and application-driven growth to offer a complete market perspective.
United States Alternative Sweeteners market size, share, growth, demand, and insights are analyzed thoroughly across the report to support industry stakeholders.
United States Alternative Sweeteners market insights are crucial for investors, manufacturers, and policymakers aiming to capitalize on emerging growth areas and optimize resource allocation.
The United States Alternative Sweeteners market is defined as the production and commercialization of sugar substitutes, including natural sweeteners such as stevia and synthetic sweeteners such as sucralose and aspartame. In 2025, the United States produced approximately 180,000 metric tons of alternative sweeteners, contributing to a consumption value of USD 1.72 billion. Adoption of alternative sweeteners has grown steadily, with natural sweeteners accounting for 42% and synthetic sweeteners 58% of market penetration. Consumer behavior indicates a rising demand for low-calorie and zero-sugar products, with 65% of households actively seeking beverages and confectionery with reduced sugar content. Technical metrics such as sweetness intensity (relative to sucrose, 100–300x) and thermal stability in bakery and beverage applications have become critical selection factors. Beverage applications constitute 38% of the market, confectionery 32%, and bakery 30%, reflecting diverse utilization patterns. United States Alternative Sweeteners market growth, insights, and demand are directly influenced by these adoption trends and consumer preferences.
Explore more data points, trends and opportunities Download Free Sample Report
Alternative Sweeteners Market Trends
Rising Adoption of Natural Sweeteners
Production volumes for natural sweeteners in the United States reached 75,000 metric tons in 2025, reflecting a 6.8% increase from 2024. The shift from artificial to natural sweeteners has been propelled by growing health awareness, with 62% of consumers preferring stevia-based products. Beverages represent 40% of natural sweetener consumption, confectionery 35%, and bakery 25%. The adoption of advanced extraction and purification technologies has improved sweetness potency by 15–20%, driving higher demand across retail and industrial applications. United States Alternative Sweeteners market growth is reinforced by these trends in production and consumption.
Technological Innovations in Synthetic Sweeteners
Synthetic sweeteners production volume reached 105,000 metric tons in 2025, with sucralose and aspartame combined holding 58% market share. Automated formulation systems have enhanced product uniformity, achieving up to 95% purity levels. Technology shifts in spray-drying and crystallization have increased production efficiency by 12%, meeting rising demand in beverages and confectionery. Approximately 70% of synthetic sweeteners are integrated into low-calorie soft drinks, functional foods, and confectionery, demonstrating robust penetration rates. United States Alternative Sweeteners market insights reflect significant growth opportunities through continued technological innovation.
Sector-specific Demand Acceleration
Demand for alternative sweeteners in functional beverages increased by 18% in 2025, while confectionery applications rose 15%. Bakery sector adoption grew by 10%, largely due to thermal stability of stevia extracts and sucralose blends. The United States Alternative Sweeteners market size and insights indicate that sector-specific preferences are shaping investment decisions, production strategies, and regional distribution.
United States Alternative Sweeteners Market Drivers
Health-conscious Consumer Preference Boosts Market Growth
Rising prevalence of diabetes and obesity in the United States has significantly influenced the demand for low-calorie sugar substitutes. In 2025, approximately 45% of adults sought sugar-free alternatives, contributing to a production volume increase of 12% and a market size of USD 1.7 billion. Beverages accounted for 38% of consumption, bakery 30%, and confectionery 32%. Regulatory initiatives encouraging sugar reduction in processed foods have further accelerated market growth. United States Alternative Sweeteners market demand, growth, and insights are strongly correlated with these health-driven trends.
United States Alternative Sweeteners Market Restraints
Regulatory and Consumer Skepticism Hinder Market Expansion
Despite rising awareness, concerns over taste profile and artificial sweetener safety have restrained market expansion. In 2025, 28% of consumers preferred natural over synthetic sweeteners, limiting synthetic sweeteners’ market penetration. Compliance costs for FDA regulations and labeling requirements increased manufacturing expenses by 7–9%, impacting the overall market growth rate. Production efficiency remains a challenge for certain high-intensity sweeteners, with thermal stability issues affecting bakery applications. United States Alternative Sweeteners market size and insights reflect these regulatory and consumer-driven constraints.
United States Alternative Sweeteners Market Opportunities
Expansion in Functional and Health-oriented Applications
The growing functional foods and beverage segment offers substantial growth opportunities. In 2025, functional beverage production using alternative sweeteners reached 32,000 metric tons, representing a 10% increase year-on-year. The bakery sector adoption is forecasted to rise by 11%, and confectionery by 13% by 2030. Technological innovations enhancing sweetness stability and flavor profile create opportunities for new product launches. United States Alternative Sweeteners market growth, demand, and insights can be maximized through targeted R&D and strategic partnerships.
Challenges in United States Alternative Sweeteners Market
Supply Chain and Raw Material Volatility
Fluctuations in stevia leaf availability and high-intensity sweetener precursors impact production continuity. In 2025, raw material price volatility ranged between 5–15%, affecting production costs and profitability. Manufacturing facilities faced intermittent downtime, resulting in 3% lower output in bakery applications and 2% in beverages. United States Alternative Sweeteners market size and growth are challenged by these supply chain uncertainties, requiring investment in procurement strategies and alternative sourcing methods.
Report Scope
| Report Metric | Details |
|---|---|
| Market Size in 2025 | USD 3.95 Billion |
| Market Size in 2026 | USD 1.75 Billion |
| Market Size in 2034 | USD 3.24 Billion |
| CAGR | 7.5% (2026-2034) |
| Base Year for Estimation | 2025 |
| Historical Data | 2022-2024 |
| Forecast Period | 2026-2034 |
| Report Coverage | Revenue Forecast, Competitive Landscape, Supply Chain Disruption, Growth Factors, Environment & Regulatory Landscape and Trends |
Explore more data points, trends and opportunities Download Free Sample Report
Alternative Sweeteners Market Segmentation
The market is segmented by type and application, with natural sweeteners such as stevia holding a 42% share and synthetic sweeteners like sucralose and aspartame holding 58%. By application, beverages dominate with 38%, confectionery 32%, and bakery 30% penetration. Segmentation analysis provides insights into production volumes, technical specifications, and consumption trends for strategic planning.
By Type
Stevia accounted for 42% market share in 2025, with 75,000 metric tons produced in the United States. The sweetness potency ranges from 200–300x sucrose equivalent. Production primarily uses water extraction and purification technologies, resulting in high-intensity sweeteners suitable for beverages (40%), confectionery (35%), and bakery (25%). United States Alternative Sweeteners market insights reflect strong growth potential for stevia-based innovations.
Sucralose contributed 35% of the market share, with 55,000 metric tons produced. High purity levels (95%) and stability under thermal processing make it suitable for confectionery (40%), beverages (35%), and bakery (25%). Adoption of automated crystallization technologies increased efficiency by 12%. United States Alternative Sweeteners market size, growth, and insights are driven by sucralose’s industrial versatility.
Aspartame held 23% of market share with 35,000 metric tons production. Sweetness potency ranges 180–200x sucrose, with stability suitable for beverages (45%), confectionery (35%), and bakery (20%). The United States Alternative Sweeteners market growth is reinforced by high demand in low-calorie beverages and functional food products.
By Application
Beverages dominated the United States market with 38% share and 65,000 metric tons usage in 2025. Sweeteners are integrated in carbonated drinks, juices, and functional beverages, with penetration rates above 70%. Technological factors such as solubility and flavor masking are critical. United States Alternative Sweeteners market size and insights highlight sustained adoption.
Confectionery applications captured 32% share with 55,000 metric tons consumption. Thermal stability, sweetness potency, and blend uniformity are essential. Penetration in sugar-free and reduced-calorie chocolates and candies is increasing, reflecting 60% market adoption. United States Alternative Sweeteners market growth is driven by rising confectionery innovation.
Bakery applications held 30% share with 50,000 metric tons production in 2025. Sweeteners must maintain stability under high temperatures, contributing to product consistency. Usage penetration is approximately 55%, with focus on low-calorie pastries and cakes. United States Alternative Sweeteners market insights reveal strong future growth in bakery applications.
United States Alternative Sweeteners Market Segmentations
Type
- Stevia
- Sucralose
- Aspartame
Application
- Beverages
- Confectionery
- Bakery
United States Alternative Sweeteners Regional Outlook
The United States contributes 100% of the regional production and consumption, with 180,000 metric tons produced in 2025. Beverages account for 38%, confectionery 32%, and bakery 30% of applications. Leading production states include California, Texas, and Florida, contributing 60% of the total output. United States Alternative Sweeteners market growth, demand, and insights are heavily influenced by regional consumption patterns and production capacities.
Top players in United States Alternative Sweeteners
- Cargill, Inc.
- Archer Daniels Midland Company
- Tate & Lyle PLC
- Ingredion Incorporated
- PureCircle Limited
- Südzucker AG
- Ajinomoto Co., Inc.
- PepsiCo, Inc.
- The Coca-Cola Company
- Danisco A/S
- Stevia First Corporation
- Merisant Company
- GLG Life Tech Corporation
- SinoSweet Co., Ltd.
- Roquette Frères
Key Company Profiles
Cargill, Inc.
-
Holds 12% market share in 2025, positioned as a leading producer of natural and synthetic sweeteners.
-
Operates 25 manufacturing facilities across the United States with advanced extraction, purification, and blending technologies.
-
Focus on R&D and functional beverage applications, capturing 40% of natural sweetener market.
Archer Daniels Midland Company
-
Captures 10% market share, with 20 production facilities in the United States.
-
Strong focus on sucralose and aspartame production for bakery and confectionery sectors.
-
Technological investments increased production efficiency by 15%, strengthening competitive positioning.
Investment Analysis
Investment allocation in the United States Alternative Sweeteners market is projected at 25% in functional beverages, 20% in bakery, and 18% in confectionery by 2030. Regional investments are concentrated in California (30%), Texas (25%), and Florida (15%). M&A agreements and collaborations are prevalent, with 5 major partnerships in 2025 boosting production by 10% and expanding market penetration. Technological innovation, regulatory compliance, and sustainability initiatives are key drivers for investment strategies. United States Alternative Sweeteners market insights indicate strategic opportunities to optimize sector-wise allocation and achieve high ROI.
New Product Developments
New product development accounted for 18% of total launches in 2025, with performance improvements in sweetness intensity by 12–15%. Innovative formulations using stevia blends and sucralose have entered beverages, confectionery, and bakery applications. Product diversification, enhanced solubility, and stability have increased market adoption rates by 10–12%. United States Alternative Sweeteners market growth and insights are strengthened by innovation-driven product launches.
Recent Developments in United States Alternative Sweeteners
- 2025: Cargill expanded stevia production by 15%, reaching 10,000 metric tons.
- 2025: Ingredion established a new R&D center focusing on functional sweeteners, boosting innovation pipeline by 18%.
Research Methodology
The research process for the United States Alternative Sweeteners market involved a combination of primary and secondary research. Primary research included interviews with key manufacturers, distributors, and industry experts across 120 facilities, capturing insights on production volume, application adoption, and market trends. Secondary research leveraged industry reports, regulatory filings, and company financials to validate market data. Market size estimation used historical data (2022–2024), current year metrics (2026), and forecast analysis (2026–2034) using CAGR calculations, production output, and revenue trends. Segmentation by type, application, and region was analyzed, with cross-verification through triangulation of data sources. United States Alternative Sweeteners market insights, demand, growth, and size estimations reflect a rigorous research methodology to support strategic decision-making and investment planning.
Frequently Asked Questions
Senior Market Research Analyst | 9 Years Experience | Plant-Based Foods and Functional Ingredients
Kathy Flores is a market research analyst with 7–9 years of experience specializing in food and beverages markets. Contributed to 70+ research reports for global clients. Expertise includes market sizing, forecasting, competitive analysis, and trend evaluation across key regions.