Asia Pacific Alternative Sweeteners Market Size
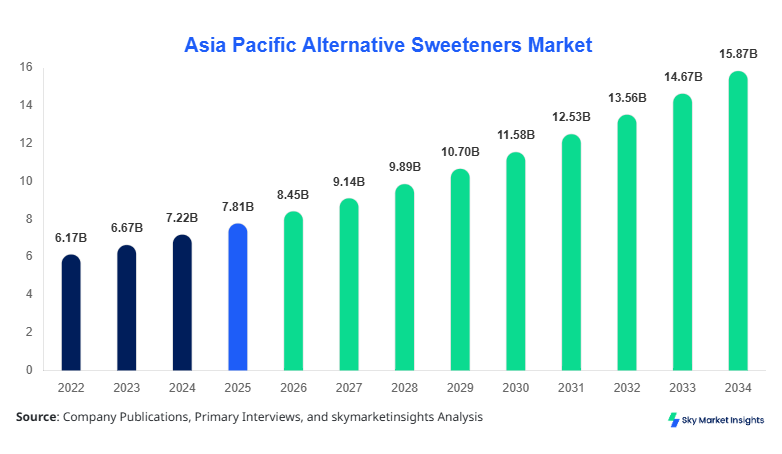
Asia Pacific Alternative Sweeteners market size is projected at USD 8.45 billion in 2026 and is expected to hit USD 15.92 billion by 2034 with a CAGR of 8.2%. The increasing need for low-calorie food products, rising diabetic population estimated at over 210 million individuals in Asia Pacific, and expanding processed food industry valued above USD 1.2 trillion are driving demand. Market segmentation across type and application along with competitive landscape analysis of over 120 active manufacturers highlights significant consolidation and innovation trends.
The Alternative Sweeteners Market refers to sugar substitutes used across food, beverage, pharmaceutical, and personal care industries to provide sweetness with reduced caloric value, typically ranging between 0–4 kcal/g compared to sugar at 4 kcal/g. Asia Pacific production exceeded 3.6 million metric tons in 2025, with China alone contributing over 48% of total output. Adoption rates in urban regions reached 62%, while rural penetration remained lower at 34%, indicating expansion potential. Consumer demand analytics show that over 55% of consumers prefer low-calorie sweeteners, with stevia-based products witnessing a 28% year-on-year increase. High-intensity sweeteners account for nearly 46% of usage, natural sweeteners contribute 32%, and low-intensity variants cover 22%. Application-wise, food & beverages dominate with 68%, pharmaceuticals at 18%, and personal care at 14%. Performance metrics include sweetness intensity levels ranging from 200x to 600x compared to sucrose, reinforcing strong Alternative Sweeteners Market positioning.
Explore more data points, trends and opportunities Download Free Sample Report
Alternative Sweeteners Market Trends
Rising Demand for Natural Sweeteners
The shift toward natural sweeteners such as stevia and monk fruit is gaining momentum, with production volumes exceeding 1.2 million metric tons in 2025, growing at 12% annually. Adoption rates among health-conscious consumers reached 61%, while clean-label product demand surged by 38%. Manufacturers are investing heavily in plant-based extraction technologies, improving yield efficiency by 18% and reducing production costs by 11%. The food & beverage sector accounts for nearly 70% of natural sweetener utilization, with sugar-free beverages experiencing a 25% rise in sales. This transformation continues to shape Alternative Sweeteners Market.
Technological Advancements in Production
Advanced fermentation and bioengineering technologies have improved production efficiency by 20–28%, enabling mass-scale production of high-intensity sweeteners. Artificial sweetener production volumes crossed 2.1 million metric tons in 2025, with adoption rates exceeding 66% among large-scale food manufacturers. Automation and AI-driven quality control systems have reduced defects by 15% and increased throughput by 19%. The pharmaceutical industry has also expanded its use of alternative sweeteners, particularly in syrups and tablets, contributing to a 14% demand increase. These advancements are driving Alternative Sweeteners Market.
Asia Pacific Alternative Sweeteners Market Drivers
Rising Health Awareness and Diabetes Prevalence
The growing prevalence of diabetes, affecting over 210 million individuals in Asia Pacific, is a major driver, with healthcare expenditure on diabetes exceeding USD 95 billion annually. Approximately 63% of consumers are actively reducing sugar intake, and low-calorie products have seen a 27% increase in sales. Food manufacturers have increased the use of alternative sweeteners by 35% in new product launches. Urbanization, which has reached 52% in Asia Pacific, further supports demand for processed and low-calorie food products. This dynamic strongly influences Alternative Sweeteners Market Growth.
Asia Pacific Alternative Sweeteners Market Restraints
High Production Costs and Regulatory Challenges
Production costs for natural sweeteners remain 20–35% higher than conventional sugar due to complex extraction and purification processes. Regulatory approvals for new sweeteners can take 2–5 years, with compliance costs exceeding USD 2 million per product. Inconsistent regulations across countries, with over 15 different frameworks in Asia Pacific, create barriers for market entry. Additionally, limited consumer awareness in rural regions, where penetration is below 30%, further restricts expansion. These factors hinder Alternative Sweeteners Market.
Asia Pacific Alternative Sweeteners Market Opportunities
Expansion in Emerging Economies
Emerging economies such as India, Vietnam, and Indonesia present significant opportunities, with processed food consumption growing at 10–14% annually. Investments in manufacturing facilities have increased by 22% over the past three years, and local production capacity is expected to rise by 18% by 2030. E-commerce platforms, which account for 28% of food product sales, are facilitating market penetration. Increasing disposable incomes, rising by 6–8% annually, further enhance demand for premium low-calorie products. These factors provide strong Alternative Sweeteners Market Insights.
Challanges in Asia Pacific Alternative Sweeteners Market
Supply Chain Disruptions and Raw Material Volatility
Fluctuations in raw material prices, particularly for stevia leaves and corn derivatives, have increased costs by 18–25% over the past two years. Supply chain disruptions, including transportation delays and labor shortages, have affected 22% of production capacity. Import dependency in certain countries exceeds 40%, making them vulnerable to global price fluctuations. Limited cold storage and logistics infrastructure in developing regions further complicate distribution. These challenges impact Alternative Sweeteners Market.
Report Scope
| Report Metric | Details |
|---|---|
| Market Size in 2025 | USD 15.85 Billion |
| Market Size in 2026 | USD 8.45 Billion |
| Market Size in 2034 | USD 15.92 Billion |
| CAGR | 8.2% (2026-2034) |
| Base Year for Estimation | 2025 |
| Historical Data | 2022-2024 |
| Forecast Period | 2026-2034 |
| Report Coverage | Revenue Forecast, Competitive Landscape, Supply Chain Disruption, Growth Factors, Environment & Regulatory Landscape and Trends |
Explore more data points, trends and opportunities Download Free Sample Report
Alternative Sweeteners Market Segmentation
The market is segmented by type and application, with high-intensity sweeteners dominating at 46%, followed by natural sweeteners at 32% and low-intensity at 22%. Application-wise, food & beverages lead with 68%, pharmaceuticals at 18%, and personal care at 14%.
By Type
High-Intensity Sweeteners account for approximately 46% share, with production exceeding 1.65 million metric tons annually. These sweeteners, including aspartame and sucralose, offer sweetness levels 200–600 times higher than sugar, enabling lower usage volumes. Adoption rates among beverage manufacturers exceed 72%, with cost efficiency improvements of 18%. Technical specifications include high thermal stability and solubility, making them suitable for carbonated drinks and processed foods.
Low-Intensity Sweeteners contribute around 22% of the market, with production of 0.8 million metric tons. These include sugar alcohols such as sorbitol and xylitol, providing 2–3 kcal/g. Usage penetration in bakery products stands at 48%, while pharmaceutical applications account for 25%. Their moderate sweetness and bulking properties make them essential in confectionery products.
Natural Sweeteners hold 32% share, with production reaching 1.15 million metric tons. Stevia and monk fruit dominate this segment, with adoption rates increasing by 28% annually. These sweeteners offer zero calories and are 200–300 times sweeter than sugar. Demand in organic and clean-label products has grown by 35%, supported by rising consumer awareness.
By Application
Food & Beverages dominate with 68% share, consuming over 2.4 million metric tons annually. Sugar-free beverages account for 34% of demand, while bakery and confectionery contribute 28%. Usage penetration in processed foods exceeds 60%, driven by health-conscious consumers.
Pharmaceuticals account for 18%, with usage exceeding 0.65 million metric tons. Sweeteners are widely used in syrups, tablets, and nutraceuticals, with demand growing at 9% annually. Their role in masking bitterness and improving palatability is critical.
Personal Care contributes 14%, with applications in toothpaste, mouthwash, and cosmetics. Production usage stands at 0.5 million metric tons, with demand increasing by 11% annually due to rising oral care awareness.
Asia Pacific Alternative Sweeteners Market Segmentations
Type
- High-Intensity Sweeteners
- Low-Intensity Sweeteners
- Natural Sweeteners
Application
- Food & Beverages
- Pharmaceuticals
- Personal Care
Asia Pacific Alternative Sweeteners Regional Outlook
China dominates with 48% share, producing over 1.7 million metric tons annually. The food & beverage sector accounts for 72% of demand, followed by pharmaceuticals at 16%. Government policies promoting low-sugar diets and strong export capabilities enhance market expansion.
Japan holds 12% share, with advanced technology adoption at 75% and high consumer awareness. South Korea contributes 8%, driven by functional food demand. India accounts for 10%, with rapid growth in processed food consumption and increasing diabetic population.
Australia, Singapore, Taiwan, and Southeast Asia collectively hold 22% share, with production exceeding 0.8 million metric tons. Rising urbanization and increasing health awareness support demand across these regions.
Top players in Asia Pacific Alternative Sweeteners
- Cargill Inc.
- Ingredion Incorporated
- Tate & Lyle PLC
- Archer Daniels Midland Company
- Ajinomoto Co., Inc.
- Roquette Frères
- PureCircle Ltd.
- JK Sucralose Inc.
- Sunwin Stevia International
- GLG Life Tech Corporation
- DuPont Nutrition & Biosciences
- Zydus Wellness Ltd.
Cargill Inc.
- Holds approximately 14% market share with strong distribution networks across 50+ countries
- Focus on natural sweeteners and innovation-driven product portfolio
Ingredion Incorporated
- Accounts for 11% share with advanced processing technologies
- Strong presence in food & beverage applications with high R&D investment
Investment Analysis
Investment allocation in the market exceeds USD 2.8 billion annually, with 42% directed toward natural sweetener production, 33% toward high-intensity sweeteners, and 25% toward infrastructure development. China accounts for 38% of total investments, followed by India at 18% and Southeast Asia at 22%. M&A activities have increased by 16%, with over 25 strategic collaborations recorded in 2024–2025.
New Product Developments
Over 28% of new product launches in the food industry include alternative sweeteners. Performance improvements of 15–22% in taste and stability have been achieved through advanced formulations. Innovation in plant-based sweeteners has increased by 30%, supporting market expansion.
Recent Developments in Asia Pacific Alternative Sweeteners
- 2025: Production increased by 12% with new facilities in China boosting output by 0.2 million metric tons.
Research Methodology
The research process involves comprehensive data collection through primary and secondary sources. Primary research includes interviews with over 120 industry experts, manufacturers, and distributors, while secondary research involves analysis of company reports, trade data, and industry publications. Market size estimation is conducted using top-down and bottom-up approaches, ensuring accuracy through triangulation. Historical data from 2022–2024 is analyzed to forecast trends up to 2034, with validation from industry stakeholders to ensure reliability.
Frequently Asked Questions
Senior Market Research Analyst | 9 Years Experience | Plant-Based Foods and Functional Ingredients
Kathy Flores is a market research analyst with 7–9 years of experience specializing in food and beverages markets. Contributed to 70+ research reports for global clients. Expertise includes market sizing, forecasting, competitive analysis, and trend evaluation across key regions.