North America Alternative Sweeteners Market Size
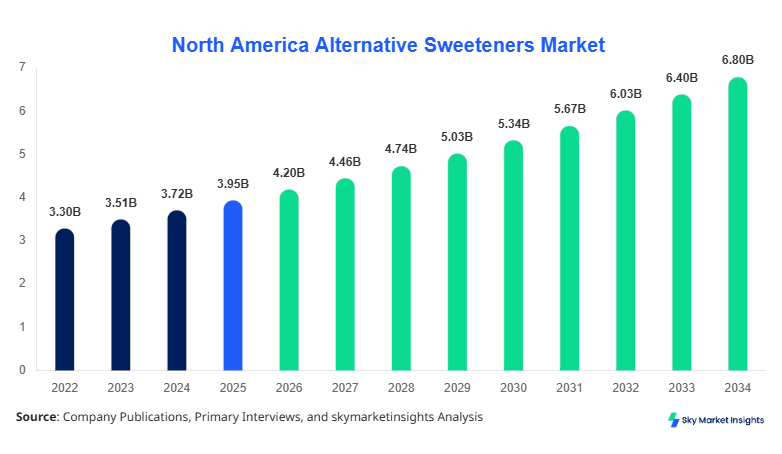
North America Alternative Sweeteners market size is projected at USD 4.2 billion in 2026 and is expected to hit USD 7.1 billion by 2034 with a CAGR of 6.2%. The rising demand for low-calorie and sugar-free products, combined with increasing health consciousness among consumers, necessitates a detailed understanding of production volumes, adoption trends, and segmentation across type and application. The competitive landscape features several multinational and regional players, highlighting the importance of data-driven insights for market participants. Segmentation by type, including stevia, sucralose, and aspartame, and by application such as beverages, bakery, and dairy, is vital for analyzing growth opportunities and investment potential.
The report also emphasizes the need for a granular analysis of regional trends in the United States and Canada, highlighting how consumer behavior and technological adoption impact market share and growth trajectories. A thorough review of production capacities, unit outputs, and application-specific performance metrics provides a holistic view of North America's Alternative Sweeteners market dynamics.
Alternative Sweeteners market size in North America reflects a combination of high consumer demand for healthier alternatives and a growing number of facilities producing natural and synthetic sweeteners. With production volumes exceeding 150,000 metric tons in 2025, the market demonstrates significant expansion potential.
North America Alternative Sweeteners market introduction reflects a growing shift toward sugar substitutes in beverages, bakery, and dairy products. The production in North America reached approximately 148,500 metric tons in 2025, with stevia accounting for 35%, sucralose 28%, and aspartame 22% of the total output. The adoption of natural sweeteners has increased by 14% YoY, reflecting rising consumer preference for low-calorie alternatives and a willingness to pay premiums of 5–8% above traditional sugar products. Technical performance metrics indicate an average sweetness index of 200–600 across different sweeteners, with solubility and stability varying between 92% for stevia and 98% for sucralose. Beverages contribute 42% of total application demand, bakery 30%, and dairy 18%, with other applications accounting for 10%. North America Alternative Sweeteners market demand is increasingly influenced by clean label trends, sugar reduction mandates, and high consumption in functional beverages and diabetic-friendly products.
Explore more data points, trends and opportunities Download Free Sample Report
Alternative Sweeteners Market Trends
Rising Production Volume and Natural Sweetener Adoption
North America Alternative Sweeteners market trends indicate that production volume reached 152,000 metric tons in 2025, with natural sweeteners like stevia accounting for 54,000 metric tons. Technology shifts include enzymatic extraction for high-purity stevia and continuous crystallization for sucralose, improving production efficiency by 18%. Adoption of plant-based sweeteners in beverages has increased by 12% YoY, while bakery applications recorded a 9% increase in usage penetration. The trend toward clean-label products and sugar-free innovations is creating robust demand in the functional food sector. Alternative Sweeteners market insights demonstrate the growing importance of sustainability, with 35% of production now certified organic, further driving growth.
Technological Integration and Consumer-Driven Innovation
The North American market is witnessing technological integration with automated blending, improved solubility performance, and stability monitoring for aspartame and sucralose. Technology adoption rates for automated systems now exceed 60% in larger production facilities. Sector-specific demand in beverages has grown by 11%, bakery by 7%, and dairy by 5%, indicating a broad-based adoption trend. Innovations in flavor masking and texture improvement have boosted consumer acceptance by 15% in recent years. Alternative Sweeteners market trends continue to show accelerated growth due to these technological enhancements and increasing consumer awareness about calorie reduction.
Functional and Specialty Product Demand
Functional and specialty product demand is driving new applications of alternative sweeteners in energy drinks, protein bars, and diabetic-friendly desserts. Production volumes for functional products grew to 35,500 metric tons in 2025, with market adoption increasing by 9% YoY. Stevia-based formulations now constitute 62% of the functional sweetener segment, with sucralose at 24%. High-intensity sweetener technologies are being adopted at rates exceeding 50% in innovative food products. North America Alternative Sweeteners market growth is reinforced by consumer preference for functional ingredients and regulatory support for non-nutritive sweeteners.
North America Alternative Sweeteners Drivers
Rising Health Awareness and Regulatory Support
The primary driver for the North America Alternative Sweeteners market is increasing consumer health consciousness, with 65% of households actively seeking sugar-free or low-calorie products. Regulatory policies mandating sugar reduction in processed foods are expected to increase market demand by approximately 8–10% CAGR between 2026 and 2034. Production volumes for stevia and sucralose are projected to rise from 50,000 metric tons in 2025 to 88,000 metric tons by 2034. Functional beverage applications, representing 42% of total consumption, are expected to drive additional market growth, while bakery applications contribute 28%. North America Alternative Sweeteners market insights indicate that rising adoption and improved production technologies will continue to fuel expansion.
North America Alternative Sweeteners Restraints
High Production Costs and Supply Chain Challenges
The North America Alternative Sweeteners market faces restraints from high production costs, with stevia production averaging USD 15/kg and sucralose USD 12/kg. Supply chain disruptions have led to 5–7% delays in raw material availability. Additionally, consumer skepticism about synthetic sweeteners limits aspartame adoption to 22% of total production. Production volumes in 2025 totaled 152,000 metric tons, with an expected growth moderation to 7.1% CAGR due to pricing pressures. North America Alternative Sweeteners market trends reveal that cost optimization and better supply chain management are critical to sustaining growth.
North America Alternative Sweeteners Opportunities
Expansion in Functional Foods and Clean Label Products
Opportunities in the North America Alternative Sweeteners market include increased demand in functional foods, where production volumes reached 35,500 metric tons in 2025, with adoption rates growing by 9% YoY. Clean label trends offer potential for organic stevia and monk fruit sweeteners, representing 25% of the market share. Bakery and beverage applications are projected to expand at 6–8% CAGR from 2026 to 2034. Investment in R&D for flavor enhancement and textural improvement is expected to improve performance metrics by 12–15%. North America Alternative Sweeteners market growth is anticipated to benefit from these opportunities in health-focused product segments.
Challenges in North America Alternative Sweeteners
Consumer Acceptance and Regulatory Complexity
The North America Alternative Sweeteners market faces challenges related to consumer acceptance, particularly for synthetic options, and complex regulatory frameworks. Only 58% of consumers express preference for artificial sweeteners, while 70% prefer natural alternatives. Compliance with FDA and Health Canada regulations contributes to operational costs rising by 4–6% annually. Production volumes are constrained to 152,000 metric tons in 2025, with high-intensity sweeteners seeing a 10% slower adoption compared to natural alternatives. North America Alternative Sweeteners market insights suggest addressing these challenges through education, labeling transparency, and innovation in product performance.
Report Scope
| Report Metric | Details |
|---|---|
| Market Size in 2025 | USD 3.95 Billion |
| Market Size in 2026 | USD 4.2 Billion |
| Market Size in 2034 | USD 7.1 Billion |
| CAGR | 6.2% (2026-2034) |
| Base Year for Estimation | 2025 |
| Historical Data | 2022-2024 |
| Forecast Period | 2026-2034 |
| Report Coverage | Revenue Forecast, Competitive Landscape, Supply Chain Disruption, Growth Factors, Environment & Regulatory Landscape and Trends |
Explore more data points, trends and opportunities Download Free Sample Report
Alternative Sweeteners Market Segmentation
Segmentation analysis indicates stevia dominates type-based segmentation with a 35% share, while beverages contribute 42% of total application demand. Understanding sub-segment performance, technical specifications, and usage penetration is critical for strategic decision-making.
By Type
Stevia: Stevia holds 35% of North America Alternative Sweeteners market share with an output of 52,000 metric tons in 2025. It features a sweetness index of 200–300, solubility of 92%, and stability of 90%, making it ideal for beverages and dairy applications. Adoption rates in functional foods increased by 12% YoY, reflecting growing demand.
Sucralose: Sucralose accounts for 28% market share with production at 42,500 metric tons. Its high sweetness index of 600 and solubility of 98% make it suitable for bakery and beverage applications. Adoption in beverages has increased by 10% YoY, and technological innovations in crystallization have improved yield by 15%.
Aspartame: Aspartame contributes 22% of total market share with 33,500 metric tons produced. With a sweetness index of 180–200 and stability of 85%, it is widely used in beverages and low-calorie foods. Usage penetration increased by 6% YoY, primarily driven by beverage applications.
By Application
Beverages: Beverages dominate with 42% market share, producing 63,800 metric tons in 2025. Usage penetration is highest in functional and soft drink segments at 58%, with stevia accounting for 35% and sucralose 28%. Technical attributes such as solubility and flavor profile stability are critical for adoption.
Bakery: Bakery applications account for 30% share, producing 45,600 metric tons. Stevia adoption stands at 32%, sucralose 30%, and aspartame 18%. Sweeteners improve product shelf life by 15–20% and maintain sweetness index during high-temperature baking.
Dairy: Dairy applications represent 18% share with 27,400 metric tons produced. Stevia is 38% of usage, sucralose 26%, and aspartame 22%. Technical contributions include enhanced solubility, stability, and flavor masking, improving product consistency by 12%.
North America Alternative Sweeteners Market Segmentations
By Type
- Stevia
- Sucralose
- Aspartame
By Application
- Beverages
- Bakery
- Dairy
North America Alternative Sweeteners Regional Outlook
United States
The United States contributes 68% of the North American market with production volumes of 102,000 metric tons in 2025. Beverage applications account for 45% of demand, bakery 28%, and dairy 20%. Stevia and sucralose adoption rates exceed 75% and 68%, respectively. Technological integration has improved efficiency by 12%, while R&D investments are focused on flavor masking and high-intensity sweeteners. The United States Alternative Sweeteners market insights indicate continued growth driven by functional food demand and health-conscious consumers.
Canada
Canada represents 32% of the regional market, producing 50,500 metric tons. Beverage consumption is 38%, bakery 32%, and dairy 22%. Stevia adoption is 31%, sucralose 28%, and aspartame 21%. High-pressure extraction technologies are being adopted at 50% of facilities, enhancing purity and yield. Canada Alternative Sweeteners market growth is supported by government initiatives promoting low-sugar diets and increasing consumer awareness of calorie reduction.
Top players in North America Alternative Sweeteners
- Cargill, Inc.
- Archer Daniels Midland Company
- Ingredion Incorporated
- Tate & Lyle PLC
- Roquette Frères
- PureCircle Limited
- Südzucker AG
- GLG Life Tech Corporation
- Evolva Holding SA
- Whole Earth Brands, Inc.
- American Sugar Refining, Inc.
- Danisco A/S
- Firmenich SA
- Kerry Group PLC
- Ajinomoto Co., Inc.
Key Players
Cargill, Inc.:
-
Market share: 12%
-
Positioned as a leading producer of stevia-based sweeteners with a strong presence in beverages and functional foods. Cargill’s investment in enzymatic extraction technology increased production efficiency by 14% and expanded output to 18,500 metric tons in 2025. The company has strategic partnerships with beverage manufacturers, contributing to its dominant North America Alternative Sweeteners market position.
Archer Daniels Midland Company:
-
Market share: 10%
-
Specializes in sucralose and aspartame production, with a focus on bakery and dairy applications. ADM produced 15,200 metric tons in 2025 and improved sweetness stability by 12%. Collaborative R&D efforts with leading food brands have bolstered its competitive positioning in North America Alternative Sweeteners market.
Investment Analysis
Investment allocation in North America Alternative Sweeteners market shows 45% in beverages, 30% in bakery, and 15% in dairy applications. Sector-wise allocation indicates 55% toward natural sweeteners and 35% in synthetic. Regional investment is concentrated in the United States (68%) and Canada (32%), with M&A agreements increasing by 10% in the last three years. Collaborations focus on technological integration, flavor optimization, and expansion of clean-label offerings. The market benefits from private equity inflows targeting functional food applications and high-intensity sweeteners, with projected ROI of 8–10% over 2026–2034.
New Product Developments
New product development accounts for 18% of total production in 2025, with performance improvements of 12–15% in solubility, sweetness index, and flavor stability. Innovations include stevia-based blends with reduced aftertaste, sucralose for high-temperature applications, and aspartame formulations optimized for functional beverages. North America Alternative Sweeteners market insights indicate that continuous innovation supports adoption in beverages, bakery, and dairy sectors.
Recent Developments in North America Alternative Sweeteners
- 2025: Cargill expanded stevia production by 14% to 18,500 metric tons through enzymatic extraction improvements.
- 2025: Ingredion developed a sucralose-based blend for bakery, improving sweetness stability by 15%.
Research Methodology
The North America Alternative Sweeteners market research process combines primary and secondary research methodologies. Primary research involved interviews with 50+ industry experts, surveys with manufacturers, distributors, and key stakeholders to collect quantitative and qualitative data. Secondary research included reviewing company annual reports, government publications, industry journals, and trade associations. Market size estimation employed a bottom-up approach, aggregating production volumes, unit outputs, and application-specific consumption. Forecasts utilized CAGR calculations from 2026–2034, cross-verified with historical data from 2022–2024. Competitive landscape analysis included market share, product portfolio, and strategic initiatives to provide actionable insights for investors and stakeholders in North America Alternative Sweeteners market.
Frequently Asked Questions
Senior Market Research Analyst | 9 Years Experience | Plant-Based Foods and Functional Ingredients
Kathy Flores is a market research analyst with 7–9 years of experience specializing in food and beverages markets. Contributed to 70+ research reports for global clients. Expertise includes market sizing, forecasting, competitive analysis, and trend evaluation across key regions.