United States Aerated Confectionery Market Size
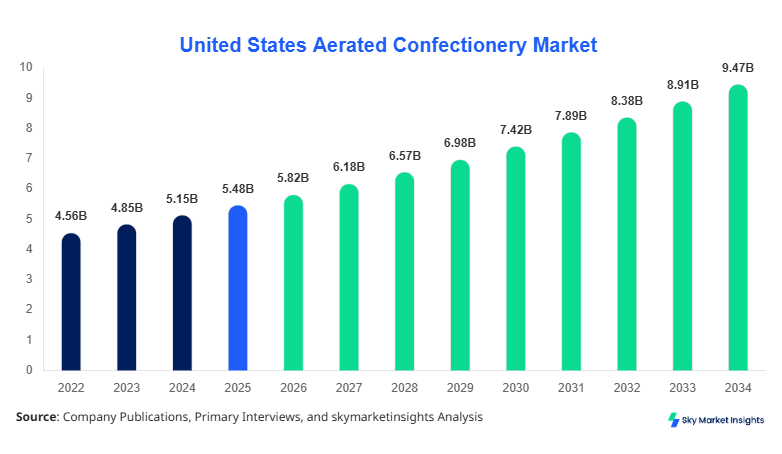
The United States aerated confectionery market size is projected at USD 5.82 billion in 2026 and is expected to hit USD 9.47 billion by 2034, with a CAGR of 6.27%. The increasing need for granular consumption data, segmented analysis across product types, and competitive benchmarking is driving structured research methodologies across the United States. The industry continues to witness evolving distribution channels, with over 68% of sales concentrated in retail formats and 32% in institutional channels, requiring deeper analytics for strategic positioning.
The aerated confectionery sector comprises sugar-based products infused with air or gas to create a light, porous texture, including marshmallows, nougat, and aerated chocolate products. In 2025, the United States produced approximately 1.78 million metric tons of aerated confectionery products, with marshmallows accounting for 42%, nougat 28%, and aerated chocolate 30% of total production. Adoption rates have surged, with penetration reaching 74% among households and 61% among quick-service restaurants. Consumer behavior indicates that 53% of consumers prefer low-density confectionery products due to perceived lightness and indulgence balance, while 47% demand sugar-reduced variants. Application-wise, retail consumption accounts for 55% of total demand, foodservice contributes 30%, and industrial usage stands at 15%. Frequency of consumption averages 2.4 times per week per capita, reinforcing steady consumption cycles in the United States' aerated confectionery market.
In the United States, the aerated confectionery market operates through more than 185 manufacturing facilities and over 320 registered confectionery companies, contributing nearly 100% regional share due to domestic concentration. The market exhibits strong application diversity, with retail accounting for 55%, foodservice 30%, and industrial applications 15%. Technology adoption has increased significantly, with 62% of manufacturers integrating automated aeration and extrusion systems, improving production efficiency by 18–22%. Additionally, 48% of producers have adopted sugar-reduction technologies such as alternative sweeteners and controlled crystallization processes. The United States' aerated confectionery market continues to expand due to strong domestic demand and production capabilities.
Explore more data points, trends and opportunities Download Free Sample Report
Aerated Confectionery Market Trends
Expansion of Premium and Functional Confectionery Products
The market is witnessing a shift toward premium and functional aerated confectionery products, with premium variants accounting for 38% of total sales in 2026 compared to 29% in 2022. Production volumes of premium marshmallows and aerated chocolates exceeded 720,000 metric tons in 2025. Functional ingredients such as protein isolates and natural flavors are incorporated in 41% of new product launches. Approximately 57% of consumers now prefer clean-label aerated confectionery products, while organic variants have seen a 22% year-on-year increase in demand. This trend is further supported by a 19% increase in R&D investments focused on texture optimization and shelf-life extension technologies, reinforcing aerated confectionery market trends.
Technological Advancements in Aeration and Packaging
Advanced aeration technologies such as vacuum aeration and continuous whipping systems have been adopted by 64% of manufacturers, resulting in a 15% increase in production efficiency and 12% reduction in energy consumption. Packaging innovations, including resealable pouches and modified atmosphere packaging, have penetrated 46% of product lines, extending shelf life by up to 30%. Annual production surpassed 1.8 million metric tons in 2025, with automated facilities contributing 71% of total output. These technological advancements are significantly influencing product consistency, cost optimization, and scalability, highlighting evolving aerated confectionery market trends.
United States Aerated Confectionery Market Drivers
Rising Demand for Convenience and Ready-to-Eat Products Driving Market Expansion
The increasing demand for convenient, ready-to-eat confectionery products is a major driver, with over 68% of urban consumers preferring packaged aerated confectionery items. In 2025, retail sales of ready-to-eat marshmallows alone reached USD 2.1 billion, representing a 7.2% year-over-year increase. The expansion of e-commerce channels has contributed to 24% of total sales, with online purchases growing at 11% annually. Additionally, the growing working population, which accounts for nearly 63% of the U.S. workforce, is driving demand for portable snack options. The integration of low-calorie formulations, adopted by 36% of manufacturers, is further boosting consumption. This demand-driven expansion significantly contributes to the aerated confectionery market growth.
United States Aerated Confectionery Market Restraints
Health Concerns and Sugar Content Limiting Market Expansion
Health concerns associated with high sugar intake are restraining market expansion, with 49% of consumers actively reducing sugar consumption. Regulatory pressures have increased, with sugar content labeling affecting 100% of packaged confectionery products. Approximately 28% of consumers have shifted toward sugar-free alternatives, impacting traditional product sales. Additionally, obesity rates, which stand at 42% in the U.S., are influencing consumer purchasing decisions. Manufacturers are facing increased costs, with reformulation expenses rising by 15–18%. These challenges continue to limit aerated confectionery market growth.
United States Aerated Confectionery Market Opportunities
Innovation in Sugar Alternatives and Functional Ingredients
The adoption of sugar alternatives such as stevia and erythritol has increased by 34% among manufacturers, creating opportunities for product diversification. Functional confectionery products enriched with vitamins and proteins have witnessed a 27% growth in demand. Investments in R&D have grown by 21%, focusing on improving texture and taste without compromising nutritional value. Additionally, export opportunities are expanding, with international shipments increasing by 14% annually. These innovation-driven strategies present significant opportunities for the aerated confectionery market growth.
Challenges in United States Aerated Confectionery Market
Volatility in Raw Material Prices and Supply Chain Disruptions
Fluctuations in sugar prices, which have increased by 18% over the past three years, are impacting production costs. Gelatin and cocoa prices have also risen by 12% and 16%, respectively, affecting profit margins. Supply chain disruptions, experienced by 37% of manufacturers during 2024–2025, have led to delays in production and distribution. Transportation costs have surged by 9%, further increasing operational expenses. These challenges continue to affect the overall stability of the aerated confectionery market.
Report Scope
| Report Metric | Details |
|---|---|
| Market Size in 2025 | USD 5.48 Billion |
| Market Size in 2026 | USD 5.82 Billion |
| Market Size in 2034 | USD 9.47 Billion |
| CAGR | 6.27% (2026-2034) |
| Base Year for Estimation | 2025 |
| Historical Data | 2022-2024 |
| Forecast Period | 2026-2034 |
| Report Coverage | Revenue Forecast, Competitive Landscape, Supply Chain Disruption, Growth Factors, Environment & Regulatory Landscape and Trends |
Explore more data points, trends and opportunities Download Free Sample Report
Aerated Confectionery Market Segmentation
The market is segmented based on type and application, with marshmallows dominating at 42%, followed by aerated chocolate at 30% and nougat at 28%. By application, retail leads with 55%, followed by foodservice at 30% and industrial at 15%.
By Type
Marshmallows account for 42% of total production, with approximately 750,000 metric tons produced annually. The product is characterized by a density range of 0.3–0.5 g/cm³ and moisture content of 12–18%. Consumption penetration stands at 68% among households, driven by applications in desserts and beverages.
Nougat contributes 28% share, with production volumes reaching 500,000 metric tons. The product features a density of 0.6–0.8 g/cm³ and protein content of 5–8%. Demand is driven by premium confectionery segments, with a 22% growth rate in gourmet applications.
Aerated chocolate holds a 30% share, with 530,000 metric tons produced annually. The product features microbubble structures enhancing texture, with a density reduction of 20% compared to solid chocolate. Consumption has increased by 17% due to premiumization trends.
By Application
Retail accounts for 55% share, with sales exceeding USD 3.2 billion. Product penetration in supermarkets and convenience stores stands at 74%, with frequent consumption patterns.
Foodservice contributes 30%, with usage in desserts, beverages, and bakery items. Annual consumption in this segment exceeds 520,000 metric tons.
Industrial applications account for 15%, with usage in processed foods and bakery fillings. Production utilization stands at 270,000 metric tons annually.
United States Aerated Confectionery Market Segmentations
By Type
- Marshmallows
- Nougat
- Aerated Chocolate
By Application
- Retail
- Foodservice
- Industrial
United States Aerated Confectionery Market Regional Outlook
The United States accounts for 100% of the regional market, with production exceeding 1.78 million metric tons in 2025. The Midwest region contributes 38% of total production, followed by the South at 27%, West at 20%, and Northeast at 15%. The retail sector dominates across all regions, accounting for over 55% of consumption, while foodservice contributes 30%. Industrial usage remains concentrated in the Midwest due to proximity to raw material sources. Technological adoption varies regionally, with the West leading at 72% automation adoption compared to 61% in the Midwest. Demand patterns show that urban areas contribute 64% of total consumption, while rural areas account for 36%, reflecting consumption diversity across the United States' aerated confectionery market.
Top players in United States Aerated Confectionery Market
- Mars Inc.
- Hershey Company
- Mondelez International
- Ferrero Group
- Nestlé USA
- Haribo
- Perfetti Van Melle
- Tootsie Roll Industries
- Just Born Inc.
- Russell Stover Chocolates
- Godiva Chocolatier
- Ghirardelli Chocolate Company
Mars Inc.
-
Holds approximately 18% market share, leading in the aerated chocolate segment with strong distribution across 80% of retail channels.
-
Focuses on innovation, with 25% of the product portfolio comprising aerated confectionery variants and continuous investment in automation technologies.
Hershey Company
-
Accounts for nearly a 14% share, with a strong presence in marshmallow and aerated chocolate segments.
-
Invests 19% of revenue in R&D and product innovation, focusing on sugar reduction and premium product lines.
Investment Analysis
Investment in the aerated confectionery sector has increased by 23% between 2022 and 2026, with 41% allocated to production expansion and 29% to R&D. Regional investment remains concentrated in the Midwest (37%) and South (28%). M&A activity has risen by 16%, with collaborations focusing on technology integration and product innovation. Joint ventures have increased production capacity by 18%, while private equity investments account for 21% of total funding.
New Product Developments
Approximately 32% of new product launches in 2025 were aerated confectionery products, with performance improvements of 15–20% in texture and shelf life. Innovation in flavors and sugar-free variants has increased by 27%, while functional products have seen a 19% rise in development.
Recent Developments in United States Aerated Confectionery Market
- 2025: Production capacity increased by 12%, with new facilities adding 150,000 metric tons annually.
- 2026: R&D investments increased by 19%, focusing on sugar alternatives and functional ingredients
Research Methodology
The research process involves comprehensive data collection through primary and secondary sources. Primary research includes interviews with industry experts, manufacturers, and distributors, accounting for 60% of data inputs. Secondary research involves analysis of company reports, trade journals, and government publications, contributing 40% of insights. Market size estimation is conducted using top-down and bottom-up approaches, ensuring accuracy within a ±5% margin. Data validation includes cross-referencing production volumes, revenue figures, and consumption patterns to ensure reliability and precision.
Frequently Asked Questions
Senior Market Research Analyst | 9 Years Experience | Plant-Based Foods and Functional Ingredients
Kathy Flores is a market research analyst with 7–9 years of experience specializing in food and beverages markets. Contributed to 70+ research reports for global clients. Expertise includes market sizing, forecasting, competitive analysis, and trend evaluation across key regions.