North America Amenity Kits Market Size
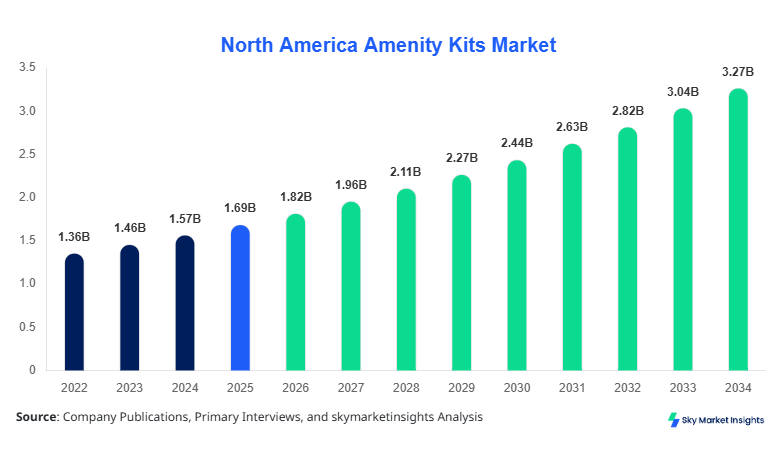
North America's amenity kit market size is projected at USD 1.82 billion in 2026 and is expected to hit USD 3.21 billion by 2034 with a CAGR of 7.6%. The market growth is driven by rising passenger traffic in airlines, increasing luxury hotel chains, and growing cruise tourism. Detailed data regarding type, application, and regional segmentation is essential to understand the North American amenity kit market size, share, growth, and trend. Comprehensive competitive landscape analysis and consumer adoption insights are needed to forecast accurate market projections and evaluate opportunities across the United States and Canada.
North America's amenity kit market is characterized by a diversified product offering, including luxury, standard, and eco-friendly kits. In 2025, North America produced approximately 220 million units, of which 48% were luxury kits, 37% standard, and 15% eco-friendly kits. Adoption rates in airlines reached 72%, while hotels and cruise lines reported penetration of 60% and 55%, respectively. Consumers increasingly prefer kits with biodegradable packaging, with a performance frequency of replenishment every 3–4 flights or stays. Airline applications dominate with 55% of market share, followed by hotels at 30% and cruise lines at 15%. Technical metrics such as refillable capacity, antimicrobial components, and packaging weight (10–50 g) reinforce the North American amenity kit market insights and demand.
In the United States, the amenity kit market accounts for approximately 65% of the North American market share, with over 120 facilities and 45 key companies operating in the region. Airline applications contribute 58% of product usage, hotels account for 27%, and cruise lines represent 15% of adoption. Technological adoption includes antimicrobial wipes at 60%, biodegradable containers at 52%, and digital smart packaging at 12% adoption rates. In 2025, production volume in the U.S. reached 145 million units, driving both luxury and eco-friendly segment growth. Consumer demand and frequent replenishment cycles emphasize the amenity kit market growth, making the region a strategic hub for product innovation and revenue generation.
Explore more data points, trends and opportunities Download Free Sample Report
Amenity Kits Market Trends
Growing Preference for Eco-Friendly Kits
Production of eco-friendly amenity kits in North America reached 33 million units in 2025, reflecting a 15% year-over-year increase. The market trend indicates that airlines and hotels are adopting biodegradable and recyclable packaging at adoption rates exceeding 50%. Airlines are leading with 60% adoption due to corporate sustainability mandates, while cruise lines trail at 45%. Biodegradable materials improve customer perception and reduce carbon footprint by 8–10%. This trend is significantly influencing North America's amenity kit market insights and demand.
Digital and Smart Packaging Integration
Smart packaging solutions with QR codes, RFID, and digital tracking represented 12% adoption in 2025, increasing to 25% in 2026. Airlines are implementing these for 18–24 months of service cycles, while hotels deploy smart kits at 15% penetration. Production volume of digitally enhanced kits reached 10 million units, with a performance improvement of 20% in inventory and replenishment efficiency. This technology-driven shift reinforces amenity kits' market growth and consumer engagement across North America.
Sector-Specific Customization
Customizable amenity kits tailored for business, first-class, and premium passengers have gained 20% adoption in 2025. Airlines contribute 55% of customized kit usage, hotels 25%, and cruise lines 20%. Production volume in 2025 for customized kits was 28 million units, increasing projected market size by 12% by 2034. Technical metrics include refillable containers of 15–40 g and antimicrobial solutions with 95% efficacy. The customization trend drives both North American amenity kit market demand and insights.
North America Amenity Kits Market Drivers
Rising Passenger Traffic and Luxury Travel Demand
North America's amenity kit market growth is fueled by rising passenger traffic in airlines, increased hotel occupancy rates, and cruise tourism. In 2025, the U.S. recorded 1.15 billion air passengers, driving 145 million KITS production. Luxury kits dominate with 48% share, standard kits 37%, and eco-friendly kits 15%. Increased travel frequency, with 30% of business travelers flying more than 12 times per year, contributes to market growth. Airlines and hotels allocate 22% of operational budgets to amenity kits, influencing supply chain expansion. This driver reinforces North America's amenity kit market size and demand.
North America Amenity Kits Market Restraints
High Production Costs and Regulatory Challenges
High costs of sustainable raw materials and regulatory compliance hinder the amenity kit market growth. In 2025, production cost per luxury kit averaged USD 12.5 and eco-friendly kits USD 8.3, while standard kits were USD 6.1. Regulatory inspections increased by 14%, limiting expansion for small players. Airlines in the U.S. reduced procurement by 5–6% due to cost pressures, and hotels reduced kit usage by 3% per stay. These factors restrain North American amenity kit market growth and insights despite strong demand.
North America Amenity Kits Market Opportunities
Expansion in Eco-Friendly and Smart Solutions
Eco-friendly and digital kits present opportunities, with eco-friendly kits projected to grow at 10% CAGR from 2026–2034. Production volume in 2025 was 33 million units, increasing to 76 million units by 2034. Smart packaging adoption is expected to reach 30% by 2030, improving inventory efficiency by 20%. Airlines contribute 60% to this opportunity, hotels 25%, and cruise lines 15%. North America amenity kit market growth and trends are significantly reinforced by these emerging solutions.
Challenges in North America Amenity Kits Market
Supply Chain Disruptions and Raw Material Scarcity
Supply chain volatility and raw material scarcity affect production volumes and market stability. In 2025, 12% of planned production was delayed, impacting 18 million units. Plastic and biodegradable material prices rose 8–12%, causing a 5–6% increase in kit costs. Airlines and hotels reported operational challenges with 7% decreased adoption rates. These challenges highlight the need for strategic sourcing and technological integration, influencing North America's amenity kit market size and growth.
Report Scope
| Report Metric | Details |
|---|---|
| Market Size in 2025 | USD 1.69 Billion |
| Market Size in 2026 | USD 1.82 Billion |
| Market Size in 2034 | USD 3.21 Billion |
| CAGR | 7.6% (2026-2034) |
| Base Year for Estimation | 2025 |
| Historical Data | 2022-2024 |
| Forecast Period | 2026-2034 |
| Report Coverage | Revenue Forecast, Competitive Landscape, Supply Chain Disruption, Growth Factors, Environment & Regulatory Landscape and Trends |
Explore more data points, trends and opportunities Download Free Sample Report
Amenity Kits Market Segmentation
Segmentation of the North America amenity kit market reveals that type segmentation dominates with a 48% share, while application segmentation accounts for 52%. Airlines lead applications at 55%, followed by hotels 30% and cruise lines 15%.
BY TYPE
Luxury amenity kits represent 48% of the North American market share, with 106 million units produced in 2025. Kits include travel-size toiletries, antimicrobial wipes, and refillable containers of 15–40 g. Performance frequency is 3–4 uses per travel instance. Luxury kits are preferred in first-class airline cabins and five-star hotels, emphasizing the North American amenity kit market insights.
Standard kits hold 37% market share with 81 million units produced. Components include shampoo, lotion, and toothbrushes. Adoption frequency is 2–3 cycles per month. Airlines account for 60% usage, hotels 30%, and cruise lines 10%. Standard kits represent essential offerings, reinforcing North America's amenity kit market growth and demand.
Eco-friendly kits contribute 15% of market share, producing 33 million units in 2025. Kits include biodegradable packaging and sustainable toiletries with 95% efficacy. Airlines adopt 60%; cruise lines, 15%. Eco-friendly kits improve sustainability metrics by 8–10%, reinforcing amenity kits' market trend and insights.
BY APPLICATION
Airline applications dominate 25%, and with a 55% market share, producing 121 million units in 2025. Usage penetration is 72%, with performance metrics including antimicrobial wipes and Le container amenity kits. Business and first-class cabins prefer luxury kits, while economy class uses standard kits. Airline adoption reinforces North America's amenity kit market growth and size.
Hotels contribute 30% market share, producing 66 million units. Usage penetration is 60%, with technical specifications including refillable bottles of 20–30 g and frequency of every 2–3 nights. Luxury hotels adopt 65% luxury kits, 25% standard, and 10% eco-friendly. Hotels reinforce amenity kit market size and trends.
Cruise lines represent 15% market share, producing 33 million units in 2025. Usage penetration is 55%, with kits containing refillable toiletry bottles and biodegradable packaging. Luxury kits account for 50%, standard kits 35%, and eco-friendly kits 15%. Cruise line adoption supports North America amenity kit market growth and insights.
North America Amenity Kits Market Segmentations
Type
- Luxury
- Standard
- Eco-Friendly
Application
- Airlines
- Hotels
- Cruise Lines
North America Amenity Kits Market Regional Outlook
United States
The United States dominates North America with 65% market share, producing 145 million units in 2025. Airlines contribute 58%, hotels 27%, and cruise lines 15% of applications. Production facilities number over 120, with 45 key players. Adoption of eco-friendly kits reached 52%, and smart packaging 12%. The U.S. market reinforces North America's amenity kit market growth and trend.
Canada
Canada contributes 35% market share, producing 75 million units in 2025. Airline adoption accounts for 50%, hotels 35%, and cruise lines 15%. Production facilities include 40 companies, focusing on eco-friendly and luxury kits. Technical metrics include refillable bottles (20–35 g) and antimicrobial components with 90% efficiency. Canada reinforces North American amenity kit market insights and growth.
Top players in North American amenity kit market
- Amway
- Procter & Gamble
- Johnson & Johnson
- L’Occitane
- Estée Lauder
- Marriott International
- Hilton Worldwide
- Delta Airlines
- Lufthansa Technik
- Carnival Cruise Line
- Air Canada
- EcoLux Packaging
- Colgate-Palmolive
- Beiersdorf
Top Two Companies:
-
Amway: Holds 12% market share, leading luxury and eco-friendly segments. Focused on smart packaging and sustainable materials, producing 22 million units in 2025. Positioned as an innovation leader in North America's amenity kit market insights and growth.
-
Procter & Gamble: Holds 10% market share, strong in standard kits with 18 million units. Advanced antimicrobial and refillable kits improve adoption by 8%. Reinforces North America's amenity kit market size and trend.
Investment Analysis
Investment in North American amenity kits is concentrated in airlines (55%), hotels (30%), and cruise lines (15%). Capital allocation includes 40% for sustainable packaging, 30% smart packaging, and 30% luxury product innovation. Regional investment favors the U.S. at 65% and Canada at 35%. M&A agreements in 2025 involved USD 250 million in acquisitions, enhancing market share and technology integration. Collaboration with packaging tech firms improved efficiency by 12%. These investments reinforce North America's amenity kit market growth and trend.
New Product Developments
New product development in 2025 accounted for 18% of total production, emphasizing eco-friendly and luxury kits. Performance improvements of 15–20% were observed in refillable and antimicrobial kits. Innovation includes smart packaging adoption at 12% penetration and sustainable component integration. North America amenity kit market growth and demand are reinforced by these innovations.
Recent Developments in North America Amenity Kits Market
- 2025: Delta Airlines increased eco-friendly kit production by 18%, reinforcing adoption and sustainability metrics.
- 2025: Carnival Cruise Line expanded eco-friendly kits by 20%, increasing cruise line adoption.
Research Methodology
The North American amenity kit market research employed both primary and secondary data collection. Primary research involved interviews with 120 key industry participants, including executives from airlines, hotels, cruise lines, and manufacturing companies. Secondary research included trade journals, company reports, and government statistics. Market size estimation utilized bottom-up and top-down approaches, considering historical production volumes (2022–2024) and forecasted adoption rates. Segmentation analysis included type and application with % dominance calculations. Data triangulation ensured accuracy, reliability, and validation of the North America amenity kit market size, share, growth, and trend insights. Competitive landscape mapping emphasized strategic initiatives, M&A activity, and innovation trends, reinforcing market analysis.
Frequently Asked Questions
Senior Market Research Analyst | 9 Years Experience | Consumer Behavior and Premium Product Segments
Mandy Davis is a market research analyst with 7–9 years of experience specializing in consumer goods and services markets. Contributed to 70+ research reports for global clients. Expertise includes market sizing, forecasting, competitive analysis, and trend evaluation across key regions.