Asia Pacific At Home Beauty Devices Market Size
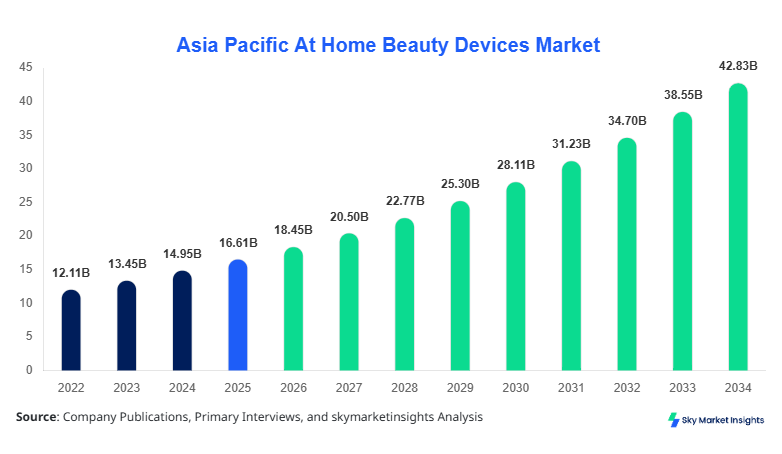
Asia Pacific At Home Beauty Devices market size is projected at USD 18.45 billion in 2026 and is expected to hit USD 42.78 billion by 2034 with a CAGR of 11.1%. The increasing need for granular data insights, segmentation-based analytics, and competitive benchmarking across China, Japan, India, and South Korea is driving structured research methodologies. The rising integration of smart beauty devices, AI-enabled diagnostics, and portable dermatology technologies further enhances the demand for detailed segmentation and competitive landscape evaluation across the Asia Pacific At Home Beauty Devices Market.
The Asia Pacific At Home Beauty Devices Market encompasses electronic and handheld devices designed for skincare, hair removal, anti-aging, acne treatment, and overall personal grooming within home settings. In 2025, regional production exceeded 185 million units, with Japan contributing nearly 28% of total output, followed by China at 35% and South Korea at 14%. Adoption rates in urban Asia Pacific reached approximately 47%, while penetration in tier-2 cities stood at 26%. Consumer behavior reflects rising demand for cost-effective alternatives to salon treatments, with 62% of users preferring multi-functional devices. Skin care devices dominate with 44% contribution, followed by hair removal devices at 33% and acne devices at 23%. Technical specifications include LED frequencies ranging between 400–700 nm and RF devices operating at 1–6 MHz, ensuring dermatological precision. Applications are split with 68% personal use, 20% professional use, and 12% dermatology clinics, reinforcing the Asia Pacific At Home Beauty Devices Market.
In the Japan, the At Home Beauty Devices Market accounts for nearly 31% of the Asia Pacific regional share, supported by over 420 manufacturing facilities and more than 150 specialized beauty tech companies. Japan produces approximately 52 million units annually, with skin care devices contributing 46%, hair removal devices 29%, and acne devices 25%. Technology adoption rates exceed 61% among urban consumers, with IoT-enabled beauty devices growing at 14% annually. Applications show 70% personal use, 18% professional use, and 12% dermatology-based deployment. Advanced microcurrent and ultrasonic devices dominate Japanese innovation, with precision levels improving by 18% over conventional technologies, reinforcing the Asia Pacific At Home Beauty Devices Market.
Explore more data points, trends and opportunities Download Free Sample Report
Asia Pacific At Home Beauty Devices Market Trends
Rising Adoption of Smart and AI-Enabled Beauty Devices
The Asia Pacific At Home Beauty Devices Market is witnessing a shift toward AI-powered and app-integrated beauty solutions, with over 38 million smart devices shipped in 2025. Approximately 54% of new devices now feature Bluetooth or Wi-Fi connectivity, enabling real-time skin analysis and personalized treatment recommendations. LED-based skin rejuvenation devices have seen adoption rise by 23%, while RF tightening devices recorded a 19% increase in demand. China leads production with over 72 million units annually, while Japan focuses on high-end premium devices. The shift toward smart ecosystems and subscription-based skincare services is transforming the Asia Pacific At Home Beauty Devices Market.
Expansion of Multi-functional and Portable Devices
Multi-functional devices combining cleansing, toning, and anti-aging capabilities accounted for 41% of total product launches in 2025. Compact, travel-friendly devices under 300 grams experienced a 27% surge in sales, driven by urban mobility and convenience preferences. South Korea and Taiwan collectively produced over 36 million portable devices, with export volumes increasing by 15%. Additionally, battery efficiency improvements of 22% and faster treatment cycles have enhanced user engagement. Dermatology-backed certifications for 35% of devices are further boosting consumer trust, strengthening the Asia Pacific At Home Beauty Devices Market.
Asia Pacific At Home Beauty Devices Market Drivers
Rising Demand for Cost-Effective Home-Based Treatments
The Asia Pacific At Home Beauty Devices Market is being driven by the increasing cost disparity between salon treatments and home-based alternatives, with professional dermatology sessions costing 3–5 times higher than device-based treatments. In 2025, nearly 64% of consumers reported switching to home devices due to affordability. Production volumes exceeded 185 million units, reflecting strong demand growth. Urban population growth of 2.8% annually and rising disposable income across India and Southeast Asia are contributing to higher adoption rates. Additionally, 58% of millennials prefer DIY skincare solutions, further accelerating market expansion. The growing awareness of skincare routines and increasing digital marketing campaigns are amplifying the Asia Pacific At Home Beauty Devices Market.
Asia Pacific At Home Beauty Devices Market Restraints
High Initial Cost and Limited Awareness in Rural Regions
Despite rapid adoption, the Asia Pacific At Home Beauty Devices Market faces restraints due to high initial device costs ranging between USD 80 to USD 450, limiting accessibility in price-sensitive markets. Rural penetration remains below 18%, particularly in India and Southeast Asia. Approximately 42% of potential consumers cite lack of awareness and technical knowledge as barriers to adoption. Furthermore, device maintenance costs and limited after-sales service networks impact consumer confidence. Regulatory compliance challenges across multiple countries, with over 9 different certification requirements, further hinder market expansion. These factors collectively restrain the Asia Pacific At Home Beauty Devices Market.
Asia Pacific At Home Beauty Devices Market Opportunities
Integration of Advanced Technologies and E-commerce Expansion
The Asia Pacific At Home Beauty Devices Market presents significant opportunities through the integration of AI, IoT, and cloud-based analytics, with smart devices expected to account for 52% of total sales by 2030. E-commerce platforms contribute over 46% of total device sales, with online channels growing at 18% annually. Emerging markets such as India and Southeast Asia are witnessing a 25% rise in digital purchases. Additionally, partnerships between beauty brands and tech companies are increasing, with over 120 collaborations recorded in 2025. Personalized skincare solutions and subscription-based models are further expanding revenue streams, boosting the Asia Pacific At Home Beauty Devices Market.
Challenges in Asia Pacific At Home Beauty Devices Market
Regulatory Complexity and Product Standardization Issues
The Asia Pacific At Home Beauty Devices Market faces challenges due to inconsistent regulatory frameworks across countries, with over 10 distinct compliance standards in the region. Product recalls increased by 6% in 2025 due to safety concerns, particularly in low-cost devices. Counterfeit products account for approximately 12% of total market supply, affecting brand credibility. Additionally, technological standardization remains an issue, with varying frequency ranges and performance outputs across devices. Limited consumer trust in unregulated products further impacts adoption. These challenges create operational complexities for manufacturers within the Asia Pacific At Home Beauty Devices Market.
Report Scope
| Report Metric | Details |
|---|---|
| Market Size in 2025 | USD 16.61 Billion |
| Market Size in 2026 | USD 18.45 Billion |
| Market Size in 2034 | USD 42.78 Billion |
| CAGR | 11.1% (2026-2034) |
| Base Year for Estimation | 2025 |
| Historical Data | 2022-2024 |
| Forecast Period | 2026-2034 |
| Report Coverage | Revenue Forecast, Competitive Landscape, Supply Chain Disruption, Growth Factors, Environment & Regulatory Landscape and Trends |
Explore more data points, trends and opportunities Download Free Sample Report
Asia Pacific At Home Beauty Devices Market Segmentation
The Asia Pacific At Home Beauty Devices Market segmentation highlights that skin care devices dominate with 44% share, followed by hair removal devices at 33% and acne devices at 23%. Application-wise, personal use leads with 68%, while professional and dermatology segments contribute 20% and 12%, respectively.
BY TYPE
Hair Removal Devices account for approximately 33% of the Asia Pacific At Home Beauty Devices Market, with annual production exceeding 61 million units. These devices utilize IPL technology with wavelengths ranging between 500–1200 nm and energy outputs of 3–6 J/cm². Adoption rates are highest in urban China and Japan, where 48% of consumers use at-home hair removal solutions. Continuous technological improvements have increased efficiency by 21%, reducing treatment time by 18%.
Skin Care Devices dominate the market with 44% share and production volume of over 81 million units annually. These devices include cleansing brushes, LED therapy tools, and microcurrent devices operating at frequencies between 0.5–2 MHz. Adoption rates exceed 52% among female consumers aged 25–45. Enhanced performance features, including 25% faster skin rejuvenation cycles, are driving demand across Asia Pacific.
Acne Devices represent 23% of the market, with approximately 43 million units produced annually. These devices use blue light therapy at 415 nm and red light at 630 nm, achieving bacterial reduction rates of up to 70%. Adoption is growing among younger demographics, with penetration reaching 36% in urban markets. Continuous innovation in portable and wearable acne devices supports market expansion.
BY APPLICATION
Personal Use dominates with 68% share, supported by over 125 million units consumed annually. Devices are designed for ease of use, portability, and safety, with 82% of products featuring automated settings. Adoption rates among millennials and Gen Z exceed 61%, driven by digital marketing and influencer campaigns.
Professional Use accounts for 20% of the market, with approximately 37 million units deployed in salons and spas. These devices offer higher power outputs and advanced features such as multi-frequency operation. Adoption in urban centers has increased by 14% annually.
Dermatology Clinics represent 12% share, with around 22 million units utilized for specialized treatments. These devices provide medical-grade precision, with performance accuracy improving by 28% compared to consumer devices. Integration with diagnostic tools enhances treatment outcomes.
Asia Pacific At Home Beauty Devices Market Segmentations
Type
- Hair Removal Devices
- Skin Care Devices
- Acne Devices
Application
- Personal Use
- Professional Use
- Dermatology Clinics
Asia Pacific At Home Beauty Devices Market Regional Outlook
China leads the region with 35% share and production exceeding 72 million units annually. The country benefits from strong manufacturing infrastructure and export capabilities, contributing 18% to global exports. Consumer adoption rates stand at 49%, driven by rising middle-class income and digital retail penetration.
South Korea holds 14% share, with production volumes reaching 28 million units. The country is known for innovation in beauty technology, with 65% of devices featuring advanced skincare functionalities. Export growth of 16% annually supports market expansion.
Japan accounts for 31% share, driven by high-end product demand and technological advancements. Production exceeds 52 million units, with premium devices contributing 42% of sales. Consumer adoption rates are among the highest at 61%.
India represents 9% share, with production of 17 million units and rapid growth in urban markets. Adoption rates are increasing at 22% annually due to rising awareness and affordability.
Australia, Singapore, Taiwan, and Southeast Asia collectively contribute 11% share, with combined production of 20 million units. These regions show strong demand for portable and multi-functional devices, with adoption rates averaging 34%.
Top players in Asia Pacific At Home Beauty Devices Market
- Panasonic Corporation
- Philips NV
- Hitachi Ltd
- YA-MAN Ltd
- NuFACE
- Lumenis Ltd
- FOREO AB
- Tria Beauty Inc
- Silk’n
- MTG Co Ltd
- Conair Corporation
- Home Skinovations Ltd
- Dr. Dennis Gross Skincare
- BeautyBio
Panasonic Corporation
- Holds approximately 14% market share with strong presence in Japan and China
- Focuses on premium devices with high-frequency microcurrent technology
- Philips NV
- Accounts for nearly 11% share with strong distribution across Asia Pacific
- Specializes in IPL hair removal devices with 22% higher efficiency
Investment Analysis
Investment in the Asia Pacific At Home Beauty Devices Market reached nearly USD 4.6 billion in 2025, with 38% allocated to R&D and 27% to manufacturing expansion. China and Japan together attract over 52% of total investments. M&A activities increased by 18%, with over 45 strategic partnerships recorded. Venture capital funding in beauty tech startups grew by 21%, focusing on AI and IoT integration. Cross-border collaborations between South Korean and Japanese firms are enhancing innovation capabilities.
New Product Developments
Approximately 29% of new products launched in 2025 feature AI-based personalization and app connectivity. Performance improvements of up to 24% in treatment efficiency have been achieved. Innovations in battery life, with 30% longer usage cycles, are enhancing consumer experience.
Recent Developments in Asia Pacific At Home Beauty Devices Market
- 2025: Panasonic increased production by 16%, launching AI-powered skincare devices with 20% higher efficiency.
- 2025: FOREO introduced multi-functional devices, boosting sales by 22% across Asia Pacific.
Research Methodology
The research process for the Asia Pacific At Home Beauty Devices Market involves a combination of primary and secondary research methodologies. Primary research includes interviews with over 120 industry experts, manufacturers, and distributors across China, Japan, and India. Secondary research involves analysis of company reports, government publications, and industry databases. Market size estimation is conducted using bottom-up and top-down approaches, ensuring accuracy through triangulation. Data validation involves cross-referencing production volumes, sales data, and regional demand patterns. Analytical tools such as SWOT analysis and Porter’s Five Forces are used to assess competitive dynamics and market positioning.
Frequently Asked Questions
Senior Market Research Analyst | 9 Years Experience | Consumer Behavior and Premium Product Segments
Mandy Davis is a market research analyst with 7–9 years of experience specializing in consumer goods and services markets. Contributed to 70+ research reports for global clients. Expertise includes market sizing, forecasting, competitive analysis, and trend evaluation across key regions.