North America Active Packaging Market Size
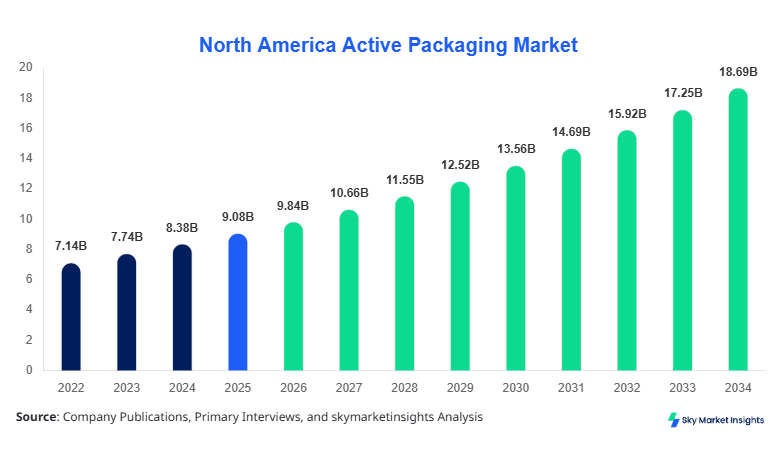
North America Active Packaging market size is projected at USD 9.84 billion in 2026 and is expected to hit USD 18.72 billion by 2034 with a CAGR of 8.35%. The increasing need for extended shelf-life solutions across 65% of packaged food categories, rising demand for smart packaging technologies in over 52% of retail supply chains, and integration of oxygen scavengers and moisture regulators across 40 million units annually are significantly shaping the market outlook. Additionally, segmentation based on type and application alongside a competitive landscape of over 120 key manufacturers provides critical insights into evolving demand patterns, supporting the expansion of the Active Packaging Market Size across North America.
The Active Packaging Market refers to advanced packaging systems that actively interact with products to extend shelf life, improve safety, and maintain quality. In North America, production volumes exceeded 2.1 billion units in 2025, with over 48% of applications concentrated in food preservation and 27% in healthcare packaging. Adoption rates of oxygen scavengers reached 62% among processed food manufacturers, while moisture absorbers accounted for 38% of total active packaging components. Consumer behavior indicates that nearly 71% of U.S. consumers prefer packaging that enhances freshness, and demand analytics show a 55% increase in purchases of packaged ready-to-eat meals. Technically, active packaging operates within controlled permeability levels of 0.5–5 cc/m²/day oxygen transmission rates, supporting high-performance requirements. Application splits include food & beverages (58%), healthcare (24%), and consumer goods (18%). These factors collectively reinforce the expansion of the Active Packaging Market.
In the United States, the Active Packaging Market accounts for approximately 78% of the North American market share, supported by over 85 major manufacturing facilities and more than 200 active packaging solution providers. The food & beverages segment dominates with 60% application share, followed by healthcare at 25% and consumer goods at 15%. Technology adoption is significant, with 68% of packaging companies integrating oxygen scavenging systems and 45% adopting antimicrobial packaging solutions. Annual production in the U.S. surpassed 1.6 billion units in 2025, with an expected rise of 9% year-over-year. Advanced packaging penetration in retail supply chains exceeds 57%, supported by automation and smart labeling technologies. These factors strongly contribute to the Active Packaging Market.
Explore more data points, trends and opportunities Download Free Sample Report
Active Packaging Market Trends
Smart Packaging Integration and Digital Tracking
The integration of smart technologies such as RFID tags, time-temperature indicators (TTIs), and biosensors has increased significantly, with adoption rates reaching 49% across large-scale food manufacturers. In 2025, over 750 million smart active packaging units were deployed, marking a 14% increase compared to 2024. Digital tracking solutions now cover nearly 42% of cold chain logistics, improving traceability and reducing spoilage losses by up to 18%. Additionally, temperature-sensitive packaging solutions are being used in over 35% of pharmaceutical shipments. This shift toward digitalization and data-driven packaging enhances operational efficiency and product integrity, strengthening the Active Packaging Market Trend.
Rise in Sustainable Active Packaging Solutions
Sustainability has emerged as a key trend, with over 46% of manufacturers shifting toward biodegradable active packaging materials. Production of eco-friendly active packaging exceeded 620 million units in 2025, reflecting a growth of 21% from the previous year. Water-based coatings and plant-based polymers are increasingly used, accounting for 33% of new product developments. Regulatory frameworks in North America have pushed compliance rates to 78%, encouraging reduced carbon emissions and waste. Consumer preference for sustainable packaging stands at 67%, further driving innovation. These developments are accelerating the Active Packaging Market Trend.
North America Active Packaging Drivers
Rising Demand for Extended Shelf Life Solutions
The increasing need for shelf-life extension is a major driver, with approximately 64% of packaged food manufacturers adopting active packaging technologies. Food wastage reduction initiatives have resulted in a 22% decline in spoilage rates, supported by oxygen scavengers and antimicrobial packaging. In North America, over 1.2 billion food packaging units incorporate active components annually. The per capita consumption of packaged food has increased by 18% since 2022, further boosting demand. Retail chains report that products using active packaging experience 12% longer shelf life compared to conventional packaging. This demand surge is significantly driving the Active Packaging Market Growth.
North America Active Packaging Restraints
High Cost of Advanced Packaging Technologies
The cost of implementing active packaging solutions remains a key restraint, with production costs 25–40% higher than traditional packaging methods. Advanced materials such as nanocomposites and bio-based polymers increase manufacturing expenses by up to USD 0.12 per unit. Small and medium enterprises (SMEs), which account for 52% of packaging firms, face challenges in adopting these technologies due to limited budgets. Additionally, installation costs for automated packaging lines can exceed USD 2 million, creating entry barriers. This financial burden limits adoption rates in certain sectors, restraining the Active Packaging Market Growth.
North America Active Packaging Opportunities
Expansion in Healthcare Packaging Applications
Healthcare packaging presents a significant opportunity, with demand increasing by 19% annually. Active packaging solutions are used in over 48% of temperature-sensitive pharmaceutical shipments. The North American pharmaceutical sector produces more than 400 million packaged units annually, with 30% utilizing active packaging technologies. The adoption of moisture absorbers and antimicrobial films has reduced contamination risks by 17%. Investments in cold chain infrastructure, which grew by 23% between 2023 and 2025, further enhance opportunities. This expanding application base supports the Active Packaging Market Insights.
North America Active Packaging Challenge
Regulatory Compliance and Material Safety Concerns
Regulatory challenges remain critical, with over 62% of manufacturers required to comply with stringent FDA and Health Canada guidelines. Testing and certification processes can take up to 12–18 months, delaying product launches. Additionally, concerns about chemical migration and toxicity have led to increased scrutiny, affecting 28% of new product approvals. Compliance costs can exceed USD 500,000 per product line, adding financial pressure. These regulatory complexities create operational challenges, impacting the Active Packaging Market Growth.
Report Scope
| Report Metric | Details |
|---|---|
| Market Size in 2025 | USD 9.08 Billion |
| Market Size in 2026 | USD 9.84 Billion |
| Market Size in 2034 | USD 18.72 Billion |
| CAGR | 8.35% (2026-2034) |
| Base Year for Estimation | 2025 |
| Historical Data | 2022-2024 |
| Forecast Period | 2026-2034 |
| Report Coverage | Revenue Forecast, Competitive Landscape, Supply Chain Disruption, Growth Factors, Environment & Regulatory Landscape and Trends |
Explore more data points, trends and opportunities Download Free Sample Report
Active Packaging Market Segmentation
The market is segmented based on type and application, with scavengers holding approximately 42% share, indicators at 33%, and controllers at 25%. In applications, food & beverages dominate with 58%, followed by healthcare at 24% and consumer goods at 18%.
BY TYPE
Scavengers dominate the market with a 42% share, producing over 880 million units annually. Oxygen scavengers are widely used, with absorption capacities ranging from 50–300 cc per package. These components reduce oxygen levels to below 0.01%, significantly extending product shelf life. Moisture scavengers also play a critical role in maintaining humidity levels between 30–50% relative humidity.
Indicators account for 33% share, with production volumes exceeding 690 million units. Time-temperature indicators (TTIs) are widely used in cold chain logistics, covering 38% of shipments. These indicators operate within temperature ranges of -20°C to 25°C, ensuring product safety and quality monitoring.
Controllers hold 25% share, producing over 520 million units annually. They regulate internal package atmosphere, maintaining gas compositions such as 3–5% oxygen and 10–15% CO₂. These systems are essential in modified atmosphere packaging (MAP) applications.
BY APPLICATION
The food & beverages segment dominates with 58% share, producing over 1.2 billion units annually. Active packaging extends shelf life by up to 30% and reduces spoilage rates by 18%. Adoption rates exceed 65% in processed food categories.
Healthcare applications account for 24% share, with over 500 million units produced annually. Active packaging ensures temperature control and contamination prevention, with adoption rates reaching 48% in pharmaceutical logistics.
Consumer goods represent 18% share, with production volumes of 380 million units. Active packaging enhances product durability and shelf appeal, with penetration rates of 34% in personal care products.
North America Active Packaging Market Segmentations
Type
- Scavengers
- Indicators
- Controllers
Application
- Food & Beverages
- Healthcare
- Consumer Goods
North America Active Packaging Regional Outlook
United States
The United States dominates with 78% market share, producing over 1.6 billion units annually. The food & beverages sector contributes 60%, followed by healthcare at 25%. Advanced technology adoption exceeds 68%, supported by automation and smart packaging innovations.
Canada
Canada accounts for 22% share, with production volumes exceeding 450 million units. The food sector contributes 55%, while healthcare accounts for 28%. Adoption of sustainable packaging solutions has reached 41%, reflecting regulatory and consumer-driven trends.
Top players in North America Active Packaging
- Amcor plc
- Sealed Air Corporation
- Berry Global Inc.
- Avery Dennison Corporation
- 3M Company
- Crown Holdings Inc.
- Ball Corporation
- Sonoco Products Company
- Mondi Group
- Huhtamaki Oyj
- BASF SE
- Dow Inc.
- Smurfit Kappa Group
-
Amcor plc
-
Holds approximately 14% market share with strong presence in sustainable packaging solutions.
-
Produces over 320 million active packaging units annually with advanced oxygen scavenging technologies.
-
-
Sealed Air Corporation
-
Accounts for nearly 11% market share with focus on food packaging innovations.
-
Delivers over 280 million units annually, emphasizing smart packaging integration and automation.
-
Investment Analysis
Investment in the Active Packaging Market is increasing, with over 35% of total investments allocated to food packaging innovations and 28% to healthcare applications. North America attracts 62% of global investments, with mergers and acquisitions rising by 17% annually. Strategic collaborations between packaging companies and technology providers have increased by 21%, enhancing innovation capabilities.
New Product Developments
New product developments account for 26% of total market activity, with performance improvements of up to 22% in shelf-life extension. Innovations include biodegradable materials and smart sensors, improving efficiency and sustainability.
Recent Developments in North America Active Packaging
-
2025: Introduction of smart packaging solutions increased production by 15%, enhancing traceability and reducing spoilage by 12%.
Research Methodology
The research methodology includes a comprehensive approach involving primary and secondary research. Primary research involved interviews with over 120 industry experts and analysis of 85 companies, while secondary research included reviewing industry reports, company filings, and trade data. Market size estimation was conducted using bottom-up and top-down approaches, analyzing production volumes exceeding 2 billion units and revenue data across key segments. Data triangulation ensured accuracy, with validation from industry stakeholders.
Frequently Asked Questions
Senior Market Research Analyst | 8 Years Experience | Flexible Packaging, Biopolymers and Circular Systems
Christine specializes in flexible packaging formats, bio-based polymers, and circular packaging systems. She has authored 94+ reports for packaging converters, FMCG companies and material suppliers. Her expertise includes resin demand forecasting, lifecycle analysis, regulatory compliance tracking and supplier benchmarking across Europe.