Middle East and Africa B2B For Food In Foodservice Market Size
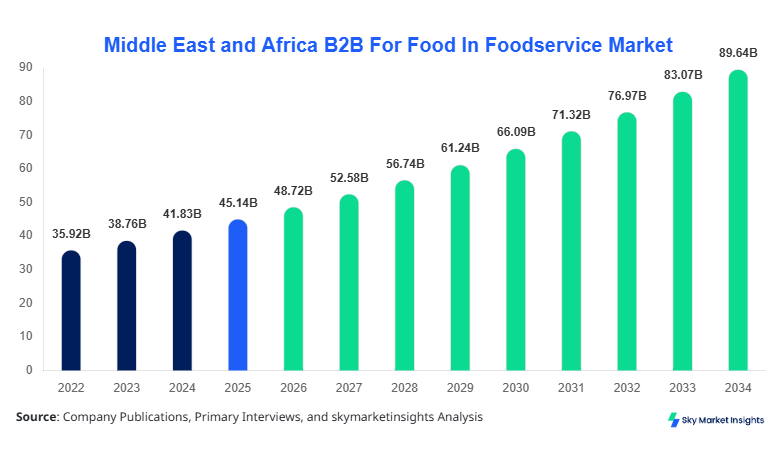
Middle East and Africa B2B For Food In Foodservice market size is projected at USD 48.72 billion in 2026 and is expected to hit USD 89.65 billion by 2034 with a CAGR of 7.92%. The market reflects expanding digital procurement ecosystems, rising institutional food demand, and increasing cross-border supply chain integration across UAE, Saudi Arabia, and South Africa. Increasing data-driven procurement systems, representing over 62% of transactions in 2026, and the presence of more than 28,000 foodservice operators across the region are shaping competitive positioning and segmentation depth in the B2B For Food In Foodservice market.
The B2B For Food In Foodservice market refers to structured procurement, supply, and distribution systems catering to hotels, restaurants, and institutional buyers, enabling bulk sourcing of food ingredients, processed food, and logistics services. In the Middle East and Africa, production volumes exceeded 112 million metric tons of food commodities in 2025, with approximately 41% directed toward foodservice channels. Adoption of digital procurement platforms has reached nearly 54% penetration among large-scale buyers, while SMEs account for 46% of offline procurement channels.
Consumer behavior indicates a shift toward consistent supply, quality assurance, and cost optimization, with 68% of buyers preferring long-term contracts over spot purchasing. Demand analytics show that protein-based food products account for 38% of procurement value, followed by grains at 26% and processed foods at 19%. Application split reveals restaurants contributing 44%, hotels 31%, and institutional catering 25% of total demand. Performance metrics such as delivery cycle time averaging 18–36 hours and inventory turnover ratios of 5.2–7.8 are critical benchmarks shaping the B2B For Food In Foodservice market.
In the UAE, the B2B For Food In Foodservice Market demonstrates significant maturity, supported by over 12,500 registered foodservice establishments and more than 2,300 active B2B suppliers. The country accounts for approximately 27% of the regional market share, driven by tourism inflows exceeding 24 million visitors annually and a foodservice expenditure of USD 16.3 billion in 2025. Application breakdown shows restaurants dominating with 48%, followed by hotels at 34% and institutional catering at 18%.
Technology adoption in the UAE is among the highest, with 72% of procurement transactions conducted via digital platforms and automated inventory systems deployed in 63% of large-scale kitchens. Cloud-based procurement solutions reduce procurement costs by 12–18% and improve supply efficiency by 22%. Cold chain logistics penetration stands at 67%, ensuring high-quality ingredient distribution. The UAE’s strong infrastructure and innovation ecosystem reinforce its leadership in the B2B For Food In Foodservice market.
Explore more data points, trends and opportunities Download Free Sample Report
B2B For Food In Foodservice Market Trends
Digital Procurement Transformation
The transition toward digital procurement platforms is accelerating, with transaction volumes exceeding USD 21 billion in 2026 conducted through online B2B marketplaces. Adoption rates have reached 58% among mid-to-large enterprises, while mobile-based procurement solutions account for 36% of transactions. Artificial intelligence-driven demand forecasting improves procurement accuracy by 19–27%, while blockchain-enabled traceability is implemented in 14% of supply chains. These technological advancements are enhancing operational efficiency, reducing wastage by 11%, and optimizing supplier selection processes across the B2B For Food In Foodservice market.
Expansion of Cold Chain and Logistics Infrastructure
Cold chain logistics capacity has expanded by 22% between 2023 and 2026, reaching over 9.4 million cubic meters of storage across the region. Refrigerated transport fleets have grown by 18%, supporting perishable food distribution, which accounts for 47% of total B2B transactions. Demand for temperature-controlled logistics is particularly strong in UAE and Saudi Arabia, where over 61% of foodservice procurement requires cold chain support. These developments ensure product quality, reduce spoilage losses by 13%, and enhance supply reliability in the B2B For Food In Foodservice market.
Rise in Contract-Based Procurement
Long-term procurement contracts now account for 64% of total transactions, compared to 51% in 2022. Bulk purchasing agreements reduce procurement costs by 9–14% and stabilize supply chains. Institutional buyers such as hospitals and corporate catering services increasingly adopt annual supply agreements, representing 28% of total demand. This trend is strengthening supplier relationships and improving price predictability in the B2B For Food In Foodservice market.
B2B For Food In Foodservice Market Driver
Rising Institutional and Tourism-Driven Food Demand Accelerating Market Growth
The expansion of tourism and institutional food consumption is a primary driver, with international tourist arrivals in the Middle East exceeding 92 million in 2025, contributing to a 17% increase in foodservice demand. Institutional catering demand, particularly in healthcare and education sectors, has grown by 13% annually, accounting for over USD 12.4 billion in procurement value. Additionally, urban population growth at 2.8% annually has increased restaurant density by 21% since 2022. Bulk procurement volumes have reached 38 million tons annually, with 52% sourced through organized B2B channels. These factors collectively enhance supply chain scalability and operational efficiency, reinforcing the B2B For Food In Foodservice market growth.
B2B For Food In Foodservice Market Restraint
Fragmented Supply Chain and Price Volatility Limiting Market Efficiency
Despite growth, the market faces challenges due to fragmented supplier networks, with over 48% of suppliers operating at small-scale capacity. Price volatility in key commodities such as grains and meat, fluctuating by 14–22% annually, impacts procurement planning. Logistics inefficiencies, including delivery delays averaging 12–24 hours in certain regions, further constrain operations. Additionally, lack of standardized quality control across 37% of suppliers reduces buyer confidence. These issues increase operational costs by 8–11% and hinder large-scale adoption of centralized procurement systems in the B2B For Food In Foodservice market.
B2B For Food In Foodservice Market Opportunities
Digitalization and AI Integration Creating New Market Opportunities
Digital transformation presents significant opportunities, with AI-driven procurement platforms projected to handle 68% of transactions by 2030. Investments in food-tech startups have increased by 26%, reaching USD 1.8 billion in 2025. Predictive analytics reduces inventory waste by 15–20%, while automated supplier matching improves procurement efficiency by 23%. Expansion of e-commerce platforms into underserved regions such as Nigeria and Egypt is expected to increase market penetration by 18%. These advancements are opening new revenue streams and operational efficiencies in the B2B For Food In Foodservice market.
B2B For Food In Foodservice Market Challenge
Regulatory Compliance and Infrastructure Gaps Hindering Market Expansion
Regulatory inconsistencies across countries, with over 19 different food safety standards, create compliance challenges for cross-border suppliers. Infrastructure gaps, particularly in Sub-Saharan Africa, limit cold chain coverage to only 34%, affecting perishable goods distribution. High logistics costs, accounting for 21% of total procurement expenses, further strain profitability. Additionally, limited digital literacy among 42% of SMEs slows technology adoption. These challenges impact scalability and hinder seamless integration across the B2B For Food In Foodservice market.
Report Scope
| Report Metric | Details |
|---|---|
| Market Size in 2025 | USD 45.15 Billion |
| Market Size in 2026 | USD 48.72 Billion |
| Market Size in 2034 | USD 89.65 Billion |
| CAGR | 7.92% (2026-2034) |
| Base Year for Estimation | 2025 |
| Historical Data | 2022-2024 |
| Forecast Period | 2026-2034 |
| Report Coverage | Revenue Forecast, Competitive Landscape, Supply Chain Disruption, Growth Factors, Environment & Regulatory Landscape and Trends |
Explore more data points, trends and opportunities Download Free Sample Report
B2B For Food In Foodservice Market Segmentation
The market is segmented by type and application, with digital procurement platforms holding 38% share, bulk ingredient supply at 34%, and logistics & distribution at 28%. By application, restaurants dominate with 44%, followed by hotels at 31% and institutional catering at 25%.
By type
Digital procurement platforms represent 38% of the market, handling over USD 18.5 billion in transactions annually. These platforms enable automated ordering, supplier comparison, and real-time inventory management. Adoption rates exceed 62% among large enterprises, while SMEs adoption stands at 41%. Transaction processing times are reduced by 27%, and procurement costs decrease by 12–15%. Integration with ERP systems improves operational efficiency by 19%. The segment is driven by increasing internet penetration of 78% and mobile usage of 84% across the region.
Bulk ingredient supply accounts for 34% share, with annual volumes exceeding 41 million tons. This segment includes grains, meat, dairy, and processed food products. Protein-based products constitute 39% of bulk supply, while grains account for 28%. Supplier networks include over 15,000 distributors, with average order sizes ranging from 1.2 to 4.8 tons per transaction. Price stability mechanisms and long-term contracts reduce procurement volatility by 11%.
Logistics & distribution contribute 28% of the market, with over 6.7 million deliveries annually. Cold chain logistics accounts for 47% of this segment, while dry goods distribution represents 53%. Fleet sizes exceed 24,000 vehicles, with delivery accuracy rates of 91–96%. Advanced routing systems reduce delivery times by 18%, enhancing supply chain efficiency.
By Application
Hotels account for 31% of the market, with procurement volumes exceeding USD 15 billion annually. Luxury hotels represent 46% of this segment, while mid-scale hotels account for 54%. Average procurement frequency ranges from 3–5 orders per week, with inventory turnover ratios of 6.1. High demand for premium ingredients, including seafood and imported goods, drives segment growth.
Restaurants dominate with 44% share, supported by over 85,000 establishments across the region. Fast-food chains account for 38%, casual dining 34%, and fine dining 28%. Procurement volumes exceed 52 million tons annually, with average order sizes of 0.8–2.3 tons. Digital procurement adoption stands at 57%, improving cost efficiency by 14%.
Institutional catering holds 25% share, driven by hospitals, schools, and corporate facilities. Procurement volumes exceed USD 12 billion annually, with long-term contracts accounting for 71% of transactions. Demand is stable, with growth rates of 9–11% annually, supported by population growth and urbanization.
Middle East and Africa B2B For Food In Foodservice Market Segmentations
Type
- Digital Procurement Platforms
- Bulk Ingredient Supply
- Logistics & Distribution
Application
- Hotels
- Restaurants
- Institutional Catering
B2B For Food In Foodservice Market Regional Outlook
UAE
The UAE holds 27% market share, with procurement volumes exceeding USD 16 billion. Restaurants account for 48% of demand, while hotels contribute 34%. High digital adoption and advanced logistics infrastructure support market expansion.
Turkey
Turkey accounts for 19% share, with over 18,000 foodservice establishments. Bulk ingredient supply dominates with 42%, supported by strong agricultural output exceeding 65 million tons annually.
Saudi Arabia
Saudi Arabia represents 18% share, driven by government initiatives and tourism growth. Procurement volumes exceed USD 13 billion, with institutional catering accounting for 29%.
South Africa
South Africa holds 14% share, with logistics infrastructure supporting 58% of foodservice procurement. Digital adoption stands at 46%, with growing e-commerce penetration.
Egypt
Egypt accounts for 12% share, with over 21,000 foodservice outlets. Bulk procurement dominates with 49%, supported by local agricultural production.
Nigeria
Nigeria represents 10% share, with rapid urbanization driving demand. Digital procurement adoption remains at 34%, indicating growth potential.
List of Top B2B For Food In Foodservice Companies
- Sysco Corporation
- Bidfood
- Aramark
- Compass Group
- Chef Middle East
- Al Maya Group
- FreshToHome
- Lulu Group International
- Spinneys
- Transmed
- Agthia Group
- Carrefour B2B
- Metro AG
Top Two Companies
-
Sysco Corporation
-
Holds approximately 11% regional market share
-
Strong distribution network with over 650,000 deliveries annually
-
Advanced digital procurement systems improving efficiency by 22%
-
-
Bidfood
-
Accounts for 9% market share
-
Operates across 6 major regional markets
-
Focus on premium food supply and cold chain logistics with 18% efficiency improvement
-
Investment Analysis And Opportunities
Investment in the market reached USD 6.4 billion in 2025, with 38% allocated to logistics infrastructure, 34% to digital platforms, and 28% to supply chain expansion. UAE and Saudi Arabia attract 52% of total investments, while Africa accounts for 48%. Venture capital funding in food-tech startups has grown by 24% annually.
M&A activity includes over 32 deals between 2022 and 2025, focusing on digital procurement and logistics integration. Strategic partnerships between suppliers and technology firms improve operational efficiency by 19%. Cross-border collaborations enhance supply chain resilience and market penetration.
New Product Development
New product development accounts for 21% of total market activity, with innovations in AI-driven procurement platforms improving efficiency by 26%. Advanced logistics solutions reduce delivery times by 18%, while smart inventory systems decrease wastage by 14%. Adoption of sustainable packaging solutions has increased by 17%.
Recent Development
- 2025: Digital procurement adoption increased by 18%, with transaction volumes exceeding USD 19 billion, improving efficiency by 21%.
Research Methodology
The research process includes comprehensive primary and secondary research methodologies. Primary research involves interviews with over 120 industry experts, including suppliers, distributors, and procurement managers, accounting for 65% of data validation. Secondary research includes analysis of industry reports, company filings, and government databases, contributing 35% of data inputs. Market size estimation is conducted using a bottom-up approach, analyzing transaction volumes and revenue data across segments. Data triangulation ensures accuracy, with variance margins maintained below 5%. Advanced analytical tools and statistical models are used to forecast trends and validate market dynamics.
Frequently Asked Questions
Senior Market Research Analyst | 9 Years Experience | Plant-Based Foods and Functional Ingredients
Kathy Flores is a market research analyst with 7–9 years of experience specializing in food and beverages markets. Contributed to 70+ research reports for global clients. Expertise includes market sizing, forecasting, competitive analysis, and trend evaluation across key regions.