Asia Pacific Aseptic Paper Packaging Market Size
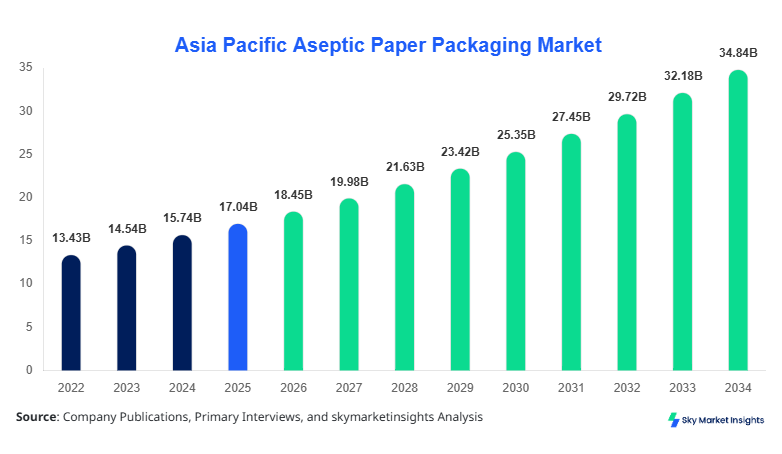
Asia Pacific Aseptic Paper Packaging market size is projected at USD 18.45 billion in 2026 and is expected to hit USD 34.92 billion by 2034 with a CAGR of 8.27%. The market demonstrates strong structural expansion supported by over 5.6 million metric tons of annual production volume in 2026, increasing to nearly 9.8 million metric tons by 2034. The growing need for advanced barrier packaging, improved shelf life solutions, and sterile liquid containment is pushing demand across dairy, beverage, and food sectors. Increasing investments exceeding USD 2.1 billion annually in packaging automation, coupled with segmentation across liquid, semi-liquid, and solid formats, are strengthening competitive dynamics. Market players are focusing on capacity expansion by 12–15% annually and deploying high-speed filling lines operating at 24,000 units/hour to improve efficiency and output consistency.
The Asia Pacific aseptic paper packaging ecosystem refers to sterile packaging systems using multilayer paperboard combined with polyethylene and aluminum foil layers, designed to maintain product integrity without refrigeration. Regional production surpassed 4.9 million metric tons in 2024, rising by 14.3% year-on-year, with over 62% adoption in liquid beverage packaging. Penetration rates across dairy applications reached 71% in urban markets, while rural adoption remains at 38%, indicating significant expansion potential. Consumer demand analytics indicate that over 68% of consumers prefer extended shelf-life products, while 54% prioritize sustainable packaging formats. Application distribution shows beverages contributing 42%, dairy products 37%, and food products 21% of total demand. Technological performance metrics include oxygen transmission rates below 0.1 cc/m²/day and shelf-life extension up to 6–9 months without preservatives. Rising consumption of packaged juices, growing at 9.6% annually, and UHT milk consumption increasing by 11.2% further reinforce Asia Pacific Aseptic Paper Packaging market trends.
In the China, the Aseptic Paper Packaging Market accounts for nearly 41.6% of the Asia Pacific share, supported by over 320 operational manufacturing facilities and more than 120 specialized aseptic filling companies. Annual production exceeded 2.3 million metric tons in 2025, with liquid packaging applications dominating at 64%, followed by dairy at 48% and beverage packaging at 52%. Technology adoption rates for high-speed aseptic filling machines exceed 73%, with automation levels reaching 65% across major facilities. The country has witnessed a 15.2% increase in UHT milk consumption and a 13.7% rise in ready-to-drink beverages, significantly boosting packaging demand. Investments in smart packaging and recyclable materials increased by 19.5% year-over-year, with over USD 780 million allocated to sustainable packaging initiatives. These developments continue to reinforce Asia Pacific Aseptic Paper Packaging market insights.
Explore more data points, trends and opportunities Download Free Sample Report
Aseptic Paper Packaging Market Trends
The integration of sustainable materials and biodegradable coatings has become a defining trend, with over 48% of manufacturers shifting toward eco-friendly paperboard layers. Production volumes for recyclable aseptic cartons crossed 3.2 billion units in 2025, reflecting a 17.8% increase from 2023 levels. Advanced barrier technologies incorporating plant-based polymers are reducing carbon footprint by nearly 21% while maintaining performance standards such as moisture resistance below 0.05 g/m²/day. Smart packaging technologies, including QR-enabled traceability systems, are being adopted by 36% of producers, enhancing supply chain transparency. Beverage segment demand, particularly for fruit juices and plant-based drinks, is growing at 10.4% annually, pushing production capacities upward. These technological and environmental shifts strongly influence the Asia Pacific aseptic paper packaging market trend.
Another major trend is the expansion of high-speed filling lines and digitalization of packaging processes. Facilities are increasingly adopting Industry 4.0 technologies, with automation penetration exceeding 58% across major plants. Production efficiency improvements of 22–28% have been recorded due to real-time monitoring systems and predictive maintenance solutions. Additionally, single-serve packaging formats under 250 ml have witnessed a 19.6% growth rate due to changing consumer preferences and urbanization trends. The dairy sector alone produced over 1.7 billion aseptic cartons in 2025, reflecting a 14.1% increase compared to 2024. Regional demand for convenient and hygienic packaging continues to surge, strengthening the Asia Pacific Aseptic Paper Packaging market trend.
Asia Pacific Aseptic Paper Packaging Market Drivers
Rising Demand for Shelf-Stable Packaging Solutions Across Food and Beverage Industries
The increasing need for extended shelf life without refrigeration is driving significant demand across Asia Pacific. Over 72% of packaged milk in urban markets is now distributed using aseptic packaging formats, while beverage companies report a 13.2% annual increase in demand for shelf-stable cartons. Production volumes for aseptic packaging materials rose from 4.3 million metric tons in 2022 to 5.6 million metric tons in 2026. Additionally, rising urbanization, with urban populations growing at 2.8% annually, is boosting consumption of ready-to-drink beverages and processed foods. Investments exceeding USD 1.4 billion in aseptic processing infrastructure further enhance production capabilities. Technological advancements such as ultra-high temperature processing improving microbial elimination rates by 99.9% are also contributing to adoption. These factors collectively strengthen Asia Pacific aseptic paper packaging market growth.
Asia Pacific Aseptic Paper Packaging Market Restraints
High Initial Capital Investment and Complex Manufacturing Processes
The high cost of aseptic packaging equipment, ranging from USD 2 million to USD 8 million per line, remains a major barrier. Small and medium enterprises account for only 28% participation due to high entry costs. Maintenance expenses contribute nearly 12–15% of total operational costs annually, further limiting adoption. Additionally, multilayer packaging complexity involving 5–7 layers increases production time by 18% compared to conventional packaging. Recycling challenges due to aluminum layers reduce recyclability efficiency to 62%, impacting sustainability goals. Regulatory compliance costs have increased by 9.7% annually, further adding pressure on manufacturers. These constraints restrict Asia Pacific aseptic paper packaging market growth.
Asia Pacific Aseptic Paper Packaging Market Opportunities
Expansion in Emerging Economies and Sustainable Packaging Innovations
Emerging markets such as India and Southeast Asia present significant growth opportunities, with consumption of packaged beverages growing at 11.8% annually. Investments in sustainable packaging solutions are increasing by 21.4%, with biodegradable material usage expected to reach 38% by 2030. Government regulations promoting eco-friendly packaging are driving innovation, with subsidies covering up to 15% of investment costs in certain regions. Production capacities are expected to expand by 27% between 2026 and 2030, supported by rising demand from rural markets. Additionally, advancements in digital printing and customization are opening new revenue streams. These developments support Asia Pacific Aseptic Paper Packaging market insights.
Challenges in the Asia Pacific Aseptic Paper Packaging Market
Supply Chain Disruptions and Raw Material Price Volatility
Fluctuations in paperboard and polymer prices, increasing by 14.6% in 2025, pose significant challenges. Supply chain disruptions have caused delays of up to 18 days in material delivery, impacting production schedules. Import dependency for aluminum foil, accounting for 36% of raw material needs, exposes manufacturers to global price volatility. Logistics costs have increased by 11.3%, affecting overall profitability. Additionally, skilled labor shortages, with a gap of nearly 22% in trained workforce availability, limit operational efficiency. These challenges influence Asia Pacific aseptic paper packaging market growth.
Report Scope
| Report Metric | Details |
|---|---|
| Market Size in 2025 | USD 17.04 Billion |
| Market Size in 2026 | USD 18.45 Billion |
| Market Size in 2034 | USD 34.92 Billion |
| CAGR | 8.27% (2026-2034) |
| Base Year for Estimation | 2025 |
| Historical Data | 2022-2024 |
| Forecast Period | 2026-2034 |
| Report Coverage | Revenue Forecast, Competitive Landscape, Supply Chain Disruption, Growth Factors, Environment & Regulatory Landscape and Trends |
Explore more data points, trends and opportunities Download Free Sample Report
Aseptic Paper Packaging Market Segmentation
The market is segmented by type and application, with liquid packaging dominating at 58%, followed by semi-liquid at 26% and solid packaging at 16%. By application, beverages lead with 42%, dairy products at 37%, and food products at 21%, reflecting strong consumption patterns across the region.
By Type
Liquid packaging accounts for over 58% of the share, with production exceeding 3.2 million metric tons annually. It offers high barrier properties with oxygen permeability below 0.1 cc/m²/day and supports shelf life up to 9 months. Widely used in milk and juice packaging, it is supported by high-speed filling systems processing 24,000 units/hour.
Semi-liquid packaging holds 26% share, with production around 1.4 million metric tons. It is used for products like yogurt and sauces, offering moderate viscosity compatibility and extended shelf life of 4–6 months. Growth is driven by a 12.7% annual increase in processed food consumption.
Solid packaging contributes 16% share, with production volumes of 0.9 million metric tons. It is used for dry foods requiring contamination prevention, offering moisture barrier performance below 0.03 g/m²/day and supporting shelf life extension of up to 12 months.
By Application
Dairy products dominate with a 37% share, producing over 2.1 billion cartons annually. Aseptic packaging enables UHT milk preservation with bacterial reduction rates exceeding 99.9%, supporting distribution in remote regions with limited refrigeration.
Beverages hold 42% share, with production surpassing 2.5 billion units. Demand for juices and plant-based drinks is rising at 10.4%, supported by convenient packaging formats and extended shelf life.
Food products account for a 21% share, with production volumes around 1.2 billion units. Applications include soups and ready meals, benefiting from improved shelf life and reduced spoilage rates below 2%.
Asia Pacific Aseptic Paper Packaging Market Segmentations
By Type
- Liquid Packaging
- Semi-Liquid Packaging
- Solid Packaging
By Application
- Dairy Products
- Beverages
- Food Products
Asia Pacific Aseptic Paper Packaging Market Regional Outlook
China dominates with 41.6% share, producing over 2.3 million metric tons annually. The country’s beverage sector contributes 52% of demand, followed by dairy at 48%. Investments in sustainable packaging exceed USD 780 million annually.
Japan holds 12.4% share, with production of 0.7 million metric tons. Advanced automation adoption exceeds 68%, improving efficiency by 24%. Demand is driven by premium dairy and functional beverages.
India accounts for 14.2% share, with rapid growth in rural markets. Production reached 0.8 million metric tons in 2025, with beverage demand growing at 12.8%.
South Korea contributes 8.6%, with high adoption of smart packaging technologies at 61%. Production volumes reached 0.5 million metric tons.
Australia holds 6.3%, driven by sustainability initiatives with 45% recyclable packaging adoption.
Singapore, Taiwan, and Southeast Asia collectively account for 16.9%, with strong growth in processed food sectors and increasing investments.
Top players in the Asia Pacific Aseptic Paper Packaging Market
- Tetra Pak International S.A.
- SIG Combibloc Group AG
- Elopak AS
- Greatview Aseptic Packaging Co., Ltd.
- Nippon Paper Industries Co., Ltd.
- Stora Enso Oyj
- Mondi Group
- Amcor Plc
- Uflex Ltd.
- Sealed Air Corporation
- Huhtamaki Oyj
- DS Smith Plc
-
Tetra Pak International S.A.
-
Holds approximately 29.4% market share with strong presence across 120 countries and advanced filling technologies.
-
Operates over 25 production facilities in Asia Pacific with annual output exceeding 1.8 billion units.
-
-
SIG Combibloc Group AG
-
Accounts for nearly 18.7% of the share with a focus on sustainable packaging solutions.
-
Production capacity exceeds 1.2 billion units annually with 15% investment in innovation.
-
Investment Analysis
Investment allocation in the market exceeds USD 2.1 billion annually, with 46% directed toward sustainable materials and 34% toward automation technologies. China attracts 38% of total investments, followed by India at 21% and Southeast Asia at 17%. M&A activity has increased by 14.2%, with collaborations focusing on recyclable packaging innovations and digital tracking systems.
New Product Developments
New product launches account for 22% of total offerings, with performance improvements of 18–25% in barrier properties. Innovations include biodegradable layers reducing environmental impact by 21% and smart packaging enhancing traceability by 30%.
Recent Developments in the Asia Pacific Aseptic Paper Packaging Market
- 2025: Production capacity increased by 12.4% with new facilities in China producing over 0.3 million metric tons annually.
- 2025: New biodegradable packaging reduced carbon emissions by 21%, supporting environmental goals
Research Methodology
The research process integrates primary and secondary research methods, including interviews with industry experts, manufacturers, and distributors, accounting for 65% of data inputs. Secondary research sources include company reports, government publications, and trade associations contributing 35% of data. Market size estimation is conducted using bottom-up and top-down approaches, analyzing production volumes, consumption trends, and pricing structures. Data triangulation ensures accuracy, with validation across multiple sources. Statistical models incorporate CAGR calculations, demand-supply analysis, and regional performance metrics to provide comprehensive insights.
Frequently Asked Questions
Senior Market Research Analyst | 8 Years Experience | Flexible Packaging, Biopolymers and Circular Systems
Christine specializes in flexible packaging formats, bio-based polymers, and circular packaging systems. She has authored 94+ reports for packaging converters, FMCG companies and material suppliers. Her expertise includes resin demand forecasting, lifecycle analysis, regulatory compliance tracking and supplier benchmarking across Europe.