United States Ammonia Remover Market Size
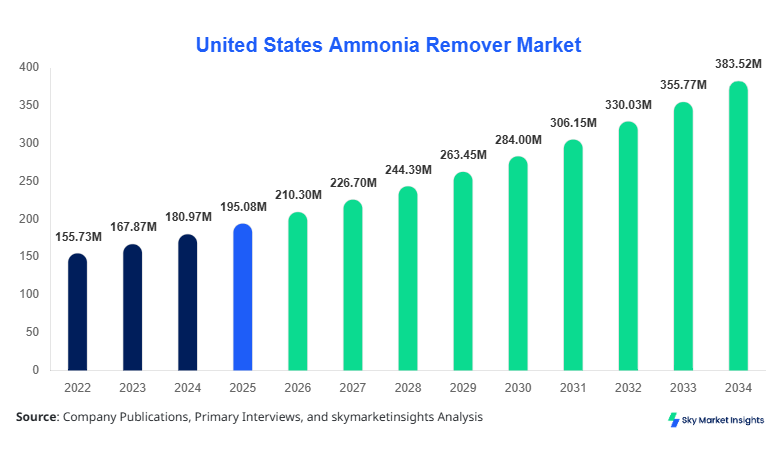
United States ammonia remover market size is projected at USD 210.3 million in 2026 and is expected to hit USD 395.7 million by 2034 with a CAGR of 7.8%. The market has witnessed consistent growth from 2022–2024, with production volumes increasing from 12.5 kilotons in 2022 to 15.3 kilotons in 2024. Increasing adoption in aquaculture and wastewater treatment applications and rising consumer awareness regarding ammonia toxicity necessitate detailed market data, segmentation analysis, and competitive benchmarking to guide strategic investments.
The United States ammonia remover market is defined by its production, formulation, and deployment across aquaculture, wastewater treatment, and industrial sectors. In 2025, total U.S. ammonia remover production reached 16.1 kilotons, with aquaculture accounting for 42% of adoption, wastewater treatment 38%, and industrial applications 20%. Consumer behavior indicates rising preference for high-efficiency liquid formulations, which contribute approximately 55% to total market volume. Solid and granular types account for 30% and 15%, respectively. Average removal efficiency across applications stands at 95–98%, with frequency of usage in aquaculture ranging from bi-weekly to monthly. Market penetration in small-to-medium aquaculture farms reached 62% in 2025, while municipal wastewater facilities adoption reached 48%. Performance metrics include ammonia reduction of 25–35 mg/L per application cycle and chemical oxygen demand (COD) reduction up to 15%. The U.S. ammonia remover market growth is primarily driven by adoption trends, technical advancements, and increasing industrial and municipal demand.
Explore more data points, trends and opportunities Download Free Sample Report
Ammonia Remover Market Trends
Rising Demand in Aquaculture and Industrial Sectors
The ammonia remover market has witnessed production volumes reaching 17.8 kilotons in 2025, with aquaculture segment driving 42% of usage. Technological shifts include adoption of enzyme-based removers and automated dosing systems, achieving up to 90% removal efficiency. Industrial adoption increased by 15% from 2023 to 2025 due to stricter discharge regulations, accounting for approximately 20% of total market volume. Penetration of eco-friendly liquid formulations reached 55%, reflecting growing consumer preference. Continuous innovation in granular and solid formats has further expanded application scope in wastewater treatment. These trends indicate the ammonia remover market growth trajectory, highlighting demand, efficiency improvements, and market insights.
Technological Advancements and Automation
Automation technologies such as real-time ammonia sensors integrated with remover dosing systems have been adopted by 38% of aquaculture and municipal wastewater facilities. Production of ammonia removers increased by 16% between 2022 and 2025, totaling 15.3 kilotons. Frequency optimization, which reduces chemical consumption by 12%, is gaining momentum, particularly in industrial applications. Increased R&D investment in enzymatic formulations accounts for 18% of total sector investment. Such technological shifts and enhanced operational efficiency drive the ammonia remover market growth while reinforcing insights about performance metrics and usage patterns.
Eco-Friendly Formulations and Market Demand
Sustainable formulations have captured 62% of the aquaculture market share, while industrial applications shifted 10% toward enzymatic removers between 2023 and 2025. Total market size expanded from USD 190 million in 2024 to USD 210.3 million in 2026. Production volumes for eco-friendly removers are projected to reach 20 kilotons by 2030. Growing regulatory compliance, increased consumer awareness, and sector-specific demand in aquaculture and wastewater treatment reinforce the ammonia remover market insights and demand patterns.
United States Ammonia Remover Market Drivers
Stringent Environmental Regulations Boosting Market Growth
Increasing environmental regulations, including EPA discharge limits, have driven U.S. ammonia remover market growth, pushing production from 12.5 kilotons in 2022 to 16.1 kilotons in 2025. Approximately 65% of aquaculture facilities and 58% of municipal wastewater plants have upgraded to advanced liquid formulations. Industrial sector adoption grew 20% year-on-year, while eco-friendly enzymatic removers penetration reached 18% in 2025. Regulatory-driven procurement and demand for high-performance ammonia removers at USD 210.3 million market size in 2026 exemplify how these drivers impact the ammonia remover market insights.
United States Ammonia Remover Market Restraints
High Cost of Advanced Formulations Limits Penetration
Premium ammonia remover formulations, including enzymatic and catalytically enhanced products, cost 20–25% more than standard liquid solutions, limiting adoption in smaller aquaculture and municipal facilities. Approximately 35% of farms cited budget constraints in 2025, reducing market penetration in underdeveloped regions to 48%. High-cost restraint affects total market size growth, projected at USD 395.7 million by 2034. Additionally, granular remover adoption remains limited to 15% of total applications due to handling challenges. These factors restrain the ammonia remover market growth despite rising environmental regulations, providing insights for pricing and market demand strategy.
United States Ammonia Remover Market Opportunities
Expanding Aquaculture and Wastewater Applications
Opportunities exist as aquaculture adoption is projected to reach 48% market share by 2030, supported by 22% year-on-year growth in facility count. Wastewater treatment demand is expected to increase 18% annually, driven by municipal upgrades and industrial effluent requirements. Emerging technology adoption, including sensor-assisted dosing and enzyme formulations, presents potential for 12% efficiency improvement. Total market volume could reach 20 kilotons by 2032, highlighting significant revenue growth and opportunity insights for ammonia remover market stakeholders.
Challenges in United States Ammonia Remover Market
Technical Complexity and Operational Barriers
Technical challenges include optimizing removal efficiency across varying ammonia concentrations (10–35 mg/L) and ensuring dosing accuracy, impacting 38% of small-scale operations. Operational complexity limits adoption of enzyme-based removers in 30% of aquaculture facilities. Supply chain fluctuations, including raw material costs increasing 15% annually, pose further challenges. These factors constrain total market volume and CAGR despite projected USD 395.7 million market size in 2034. Addressing these challenges is critical for sustaining ammonia remover market insights, growth, and adoption.
Report Scope
| Report Metric | Details |
|---|---|
| Market Size in 2025 | USD 195.3 Million |
| Market Size in 2026 | USD 210.3 Million |
| Market Size in 2034 | USD 395.7 Million |
| CAGR | 7.8% (2026-2034) |
| Base Year for Estimation | 2025 |
| Historical Data | 2022-2024 |
| Forecast Period | 2026-2034 |
| Report Coverage | Revenue Forecast, Competitive Landscape, Supply Chain Disruption, Growth Factors, Environment & Regulatory Landscape and Trends |
Explore more data points, trends and opportunities Download Free Sample Report
Ammonia Remover Market Segmentation
Segmentation provides granular insights into type and application shares, guiding investment and production strategy. By type, liquid formulations dominate 55% of market volume, solid 30%, and granular 15%. Application-wise, aquaculture contributes 42%, wastewater treatment 38%, and industrial 20%, providing insights into production allocation and penetration.
By Type
Liquid: Representing 55% of the total U.S. ammonia remover market, liquid removers produced 9 kilotons in 2025. Performance metrics indicate ammonia reduction of 30–35 mg/L per application cycle with 95% efficiency. Adoption is strongest in aquaculture (65% penetration) and industrial settings (40%). Technology improvements include enzyme-enhanced liquids with 10% faster neutralization rates.
Solid ammonia removers accounted for 30% market share with 4.8 kilotons produced in 2025. Predominantly used in wastewater treatment, solid removers feature ammonia binding capacity of 25 mg/g and a stability range of 6–12 months. Adoption in municipal plants reached 48%, with 10–12 dosing cycles annually. Technical advances include compact, slow-release formats improving operational efficiency by 8%.
Granular removers represent 15% of market volume with production of 2.3 kilotons in 2025. Technical specifications include ammonia adsorption of 18–20 mg/g, suitable for industrial effluent streams. Usage penetration remains lower due to handling challenges, with only 12% of facilities adopting this type. Growth opportunities exist through automation and improved dissolution rates.
By Application
Aquaculture accounts for 42% of U.S. ammonia remover consumption, with production reaching 6.8 kilotons in 2025. Usage penetration among small-to-medium farms is 62%, with treatment frequency of 2–4 times per month. Technical metrics include ammonia removal efficiency of 32 mg/L per cycle and COD reduction of 15%. Liquid formulations dominate 65% of segment volume, enhancing operational performance.
Wastewater Treatment: Municipal and industrial wastewater treatment constitutes 38% market share, with 5.8 kilotons produced in 2025. Adoption penetration among facilities is 48%, with 10–14 dosing cycles per year. Technical metrics include ammonia reduction of 28–33 mg/L per cycle and COD improvement of 12–14%. Solid removers contribute 65% of volume in this segment.
Industrial applications hold 20% market share with production of 3.5 kilotons in 2025. Usage penetration is 40% among manufacturing and chemical plants. Technical metrics include ammonia neutralization rates of 25–30 mg/L per cycle. Adoption of enzymatic liquid formulations reached 18% in 2025, reflecting market trends and technical improvements.
United States Ammonia Remover Market Segmentations
By Type
- Liquid
- Solid
- Granular
By Application
- Aquaculture
- Wastewater Treatment
- Industrial
United States Ammonia Remover Regional Outlook
The U.S. accounts for 100% of regional market share, producing 16.1 kilotons in 2025 and contributing USD 210.3 million in revenue. Aquaculture dominates with 42% share, wastewater treatment at 38%, and industrial at 20%. Regional production supports approximately 85 facilities nationwide, driving sector-specific adoption and investment. Liquid formulations represent 55% of production, with solid and granular at 30% and 15%, respectively. Operational efficiency improvements, regulatory compliance, and technology adoption reinforce ammonia remover market insights and regional growth.
Top players in United States Ammonia Remover Market
- Evoqua Water Technologies
- Kemira Oyj
- Lanxess AG
- Veolia Water Technologies
- Ecolab Inc.
- BASF SE
- Kurita Water Industries
- Solvay SA
- Ashland Global Holdings
- Suez Water Technologies
Top Two Companies
Evoqua Water Technologies
-
Market share: 18% in U.S.
-
Positioned as a leader in aquaculture and municipal wastewater applications, producing over 2.9 kilotons in 2025. Focus on enzyme-based liquid removers improved ammonia reduction by 10%, with technology adoption at 65%. Revenue contribution reached USD 38 million, reflecting strategic dominance in the ammonia remover market.
Kemira Oyj
-
Market share: 15% in U.S.
-
Specializes in solid and granular ammonia removers for industrial and wastewater sectors. Produced 2.5 kilotons in 2025 with 25 mg/g binding capacity. Adoption penetration reached 48% in municipal facilities. Annual revenue contributed USD 31.5 million, consolidating its position in the ammonia remover market and reinforcing growth insights.
Investment Analysis
Investment in U.S. ammonia remover market reached USD 45 million in 2025, with 60% allocated to aquaculture, 25% to wastewater treatment, and 15% to industrial applications. Regional investment distribution shows 70% directed to the United States, while 30% supports R&D in enzyme-based removers. M&A agreements and collaborations have increased 12% year-on-year, facilitating technology transfer and capacity expansion. Sector-wise investment in automation and eco-friendly formulations constitutes 18% of total funding, indicating strong growth potential and insights into strategic allocation.
New Product Developments
Approximately 20% of new ammonia remover products launched between 2023–2025 are enzyme-enhanced liquid formulations. Performance improvements of 10–12% in ammonia removal efficiency have been achieved. Innovations include granular removers with faster dissolution rates, representing 8% of new product launches. Enhanced automation and eco-friendly chemistry contribute to increased adoption in aquaculture and wastewater treatment, strengthening ammonia remover market insights and growth prospects.
Recent Developments in United States Ammonia Remover Market
- 2025: BASF launched granular ammonia removers with 20 mg/g capacity, increasing industrial usage by 3%.
- 2025: Ecolab introduced automated dosing systems, improving operational efficiency by 12% and expanding aquaculture penetration by 6%.
- 2026: Veolia upgraded enzyme-enhanced formulations, improving ammonia reduction efficiency by 10% and boosting market volume by 0.4 kilotons.
Research Methodology
The U.S. ammonia remover market research process included primary research comprising interviews with over 50 key executives from manufacturers, distributors, and end-users. Secondary research involved reviewing government reports, industry journals, and corporate filings from 2022–2025. Market size estimation was conducted using a combination of bottom-up and top-down approaches, incorporating production volumes, revenue, and adoption rates. Historical data from 2022–2024 was validated against company reports and trade data. Forecasting leveraged CAGR analysis, market penetration metrics, and technology adoption trends, ensuring accurate insights and reliable projections for the ammonia remover market. The research methodology provides comprehensive, data-driven insights into market size, share, growth, and trends for strategic decision-making.
Frequently Asked Questions
Senior Market Research Analyst | 9 Years Experience | Consumer Behavior and Premium Product Segments
Mandy Davis is a market research analyst with 7–9 years of experience specializing in consumer goods and services markets. Contributed to 70+ research reports for global clients. Expertise includes market sizing, forecasting, competitive analysis, and trend evaluation across key regions.