Middle East and Africa Smart Pole Market Size
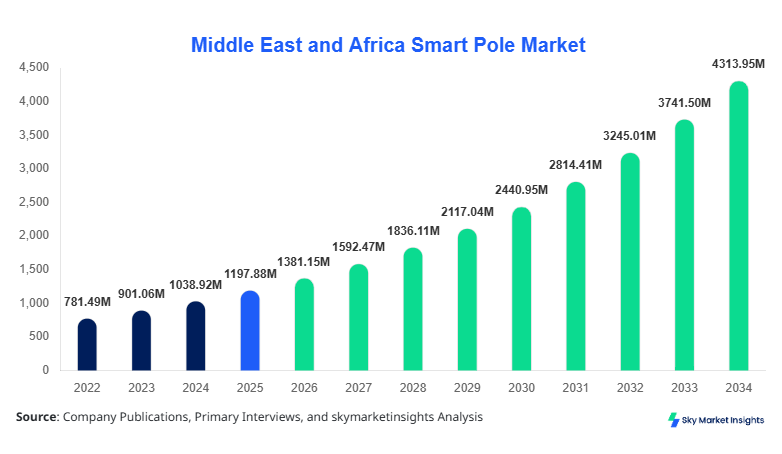
Middle East and Africa Smart Pole Market size is projected at USD 1,381.15 million in 2026 and is expected to hit USD 4,374.64 million by 2034 with a CAGR of 15.3%. The industry is transitioning from conventional street-lighting infrastructure toward multifunctional urban nodes integrating LED luminaires, cameras, environmental sensors, wireless communication, traffic monitoring, and centralized controllers. Assessment of offerings, installation models, applications, connectivity, materials, country-level demand, and the competitive landscape is essential for identifying investment opportunities through 2034.
Key Takeaways
- Dominant country: The United Arab Emirates accounts for approximately 51.18% of the 2026 country total, reaching USD 706.90 million, and is forecast at USD 2,249.66 million by 2034, with a 15.57% CAGR.
- Fastest-growing country: South Africa records the highest country CAGR at 16.10%, expanding from USD 159.24 million in 2026 to USD 525.68 million by 2034.
- Dominant offering: Hardware represents approximately 54.52% of the 2026 offerings total at USD 753.09 million, reaching USD 2,440.15 million by 2034 at a 15.83% CAGR.
- Fastest-growing offering: Hardware is also the fastest-growing quantified offering at 15.83% CAGR, ahead of services at 15.37% and software at 14.99%.
- Emerging country: Egypt is forecast to advance from USD 115.46 million in 2026 to USD 368.96 million by 2034, representing a 15.63% CAGR.
- The market encompasses intelligent pole infrastructure combining lighting with telecommunications, surveillance, traffic management, environmental sensing, Wi-Fi, IoT gateways and control systems. Based on supplied data, the 2026 country total is USD 1,381.15 million, compared with USD 1,195.82 million in 2025. The UAE contributes 51.18%, Saudi Arabia 15.29%, South Africa 11.53%, Egypt 8.36%, Turkey 7.39%, and Nigeria 6.25%. By offering, hardware contributes approximately 54.52% of the separate 2026 offerings total of USD 1,381.26 million, software contributes 29.87%, and services contribute 15.61%.
Explore more data points, trends and opportunities Download Free Sample Report
Middle East and Africa Smart Pole Market Trends
Convergence of Lighting, 5G and Urban IoT Infrastructure
Urban poles are increasingly evolving into shared digital-infrastructure platforms rather than standalone luminaires. Dubai's intelligent transport ecosystem illustrates this shift: in June 2025, the RTA expanded smart pedestrian signals to 27 locations, adding 10 locations after an initial 17-intersection phase. Smart poles can similarly consolidate cameras, environmental monitors, Wi-Fi routers and communications equipment into existing streetscape infrastructure.
Technology architecture is moving toward 4G/5G small cells, IoT sensing, edge processing and centrally managed lighting. In Saudi Arabia, the 2025 KAFD-Huawei smart-city partnership covered a 1.6-million-square-meter development and included Wi-Fi 7, 5G-A, AI, IoT, cloud technologies and smart-pole solutions. Riyadh Municipality also identifies smart poles as part of its sustainable-lighting program aimed at reducing electricity consumption and improving urban services.
Middle East and Africa Smart Pole Market Drivers
Smart-City Investment and Digital Infrastructure Integration Accelerate Deployment
Government-led digitization is increasing requirements for connected lighting, traffic intelligence and communications infrastructure. Dubai expanded intelligent pedestrian infrastructure from 17 to 27 locations, an increase of approximately 58.8% in covered sites during the second phase, while KAFD's 1.6-million-square-meter smart-city program combines 5G-A, Wi-Fi 7, AI and IoT capabilities. Such programs strengthen the business case for poles capable of accommodating multiple devices while reducing the need for separate street-level structures.
Middle East and Africa Smart Pole Market Restraints
High Integration Complexity and Multi-System Requirements Limit Rapid Rollout
Smart infrastructure can require simultaneous integration of 4G/5G, Wi-Fi, cameras, lighting controls, IoT sensors and cloud platforms, increasing engineering and interoperability requirements compared with conventional poles. A multifunctional installation may incorporate 5 or more technology layers while operating continuously for 24 hours per day. The transition also requires coordination among municipalities, utilities and telecom operators, particularly where legacy lighting networks must support higher electrical loads, fiber connectivity and data-security requirements.
Middle East and Africa Smart Pole Market Opportunities
Retrofit Infrastructure Creates a Scalable Platform for Connected Urban Services
Existing lighting networks provide a physical footprint for adding sensors, communications equipment and intelligent controls without constructing entirely new street infrastructure. Riyadh's municipal datasets specifically track halogen, LED and solar-powered streetlights, highlighting the diversity of infrastructure available for modernization. Integrated platforms can combine 3 major lighting categories with communications, environmental monitoring and central management, creating opportunities across roads, public spaces and transportation corridors.
Challenges in Middle East and Africa Smart Pole Market
Cybersecurity, Data Governance and Harsh Operating Conditions Increase Lifecycle Complexity
Connected poles can simultaneously handle 4G/5G, Wi-Fi, video, environmental and operational data, making security architecture substantially more complex than conventional lighting. Systems operating 24/7 must also withstand high temperatures, dust and intensive solar exposure while supporting multiple electronic modules. Municipal buyers consequently evaluate not only installation costs but also cybersecurity, maintenance intervals, software updates, communications uptime and interoperability across 5 or more embedded technology functions.
Report Scope
| Report Metric | Details |
|---|---|
| Market Size in 2025 | USD 405.29 Million |
| Market Size in 2026 | USD 1381.15 Million |
| Market Size in 2034 | USD 4374.64 Million |
| CAGR | 15.3% (2026-2034) |
| Base Year for Estimation | 2025 |
| Historical Data | 2022-2024 |
| Forecast Period | 2026-2034 |
| Report Coverage | Revenue Forecast, Competitive Landscape, Supply Chain Disruption, Growth Factors, Environment & Regulatory Landscape and Trends |
Explore more data points, trends and opportunities Download Free Sample Report
Middle East and Africa Smart Pole Market Segmentation
The industry is segmented by offerings, installation type, application, connectivity technology and material. Within quantified offerings, hardware dominates with approximately 54.52% of 2026 revenue, followed by software at 29.87% and services at 15.61%.
By Offerings
Hardware, including poles, luminaires, sensor modules, communication devices and controllers, is the largest offering, increasing from USD 650.17 million in 2025 to USD 753.09 million in 2026 and USD 2,440.15 million by 2034, representing a 15.83% CAGR. It contributes approximately 54.52% of the 2026 offerings total.
Hardware is also the fastest-growing quantified subsegment at 15.83% CAGR. Software rises from USD 412.53 million in 2026 to USD 1,261.05 million in 2034 at 14.99%, while services advance from USD 215.64 million to USD 676.81 million at 15.37%.
By Installation Type
New installation and retrofit installation constitute the two deployment models. No numerical split was supplied for these categories; therefore, no unsupported market value or CAGR is assigned. The overall quantified 2026 offerings total remains USD 1,381.26 million, reaching USD 4,378.01 million by 2034 at 15.40% CAGR.
New installations support integrated smart-city corridors, while retrofit projects convert existing lighting assets into connected infrastructure. Because the supplied tables do not identify the larger or faster-growing installation type, numerical subsegment dominance cannot be stated reliably.
By Application
Applications include highways and roadways, public places such as parks and plazas, and railways and harbors. The supplied dataset provides an overall 2026 offerings value of USD 1,381.26 million and a 2034 value of USD 4,378.01 million, but does not allocate these amounts among application categories.
Highways can support traffic sensing, cameras and communications, while public places can combine lighting, Wi-Fi and environmental monitoring. Railways and harbors offer additional security and connectivity use cases. No application-specific CAGR has been supplied, preventing unsupported designation of a fastest-growing application.
By Connectivity Technology
Connectivity is divided between cellular technologies—including 4G, 5G and NB-IoT—and alternatives including Wi-Fi, Zigbee, Bluetooth, fiber and PLC. The supplied numerical tables do not assign revenue or CAGR to either connectivity category; consequently, the USD 1,381.26 million 2026 offerings total cannot reliably be divided between them.
Cellular infrastructure supports wide-area communications and small-cell integration, while the second group contains at least 5 distinct connectivity approaches. No quantified evidence supplied identifies either category as the largest or fastest-growing connectivity subsegment.
By Material
Metallic poles include steel and aluminum, while composite materials represent an emerging lightweight alternative. The supplied dataset does not quantify either material category; therefore, the 15.40% overall offerings CAGR cannot be attributed to metallic or composite poles individually.
Metallic infrastructure benefits from established manufacturing and structural characteristics, whereas composites target lower weight and corrosion-management requirements. Since no material-specific values or CAGR figures were provided, numerical dominance and fastest-growing status remain unassigned.
Middle East and Africa Smart Pole Market Segmentations
By Offerings
- Hardware (poles, luminaires, sensor modules, communication devices, controllers)
- Software (management, analytics platforms)
- Services (installation, maintenance)
By Installation Type
- New Installation
- Retrofit Installation
By Application
- Highways and Roadways
- Public Places (parks, plazas)
- Railways and Harbors
By Connectivity Technology
- Cellular (4G/5G/NBIoT)
- Wi-Fi, Zigbee, Bluetooth, Fiber, PLC
By Material
- Metallic (steel, aluminum)
- Composite (emerging lightweight materials)
Middle East and Africa Smart Pole Market Country Outlook
The supplied country dataset covers the United Arab Emirates, Saudi Arabia, South Africa, Egypt, Nigeria and Turkey. The requested Brazil, Mexico, Argentina, Chile and Colombia breakdown is not used because those countries fall outside the Middle East and Africa dataset and no mandatory numerical values were supplied for them.
United Arab Emirates
The UAE leads with USD 706.90 million in 2026, representing approximately 51.18% of the supplied country total. Revenue is forecast to reach USD 2,249.66 million by 2034 at 15.57% CAGR, supported by connected transport, lighting, surveillance and digital-city infrastructure.
Saudi Arabia
Saudi Arabia contributes approximately 15.29% in 2026, with USD 211.14 million, increasing to USD 657.19 million by 2034 at 15.25% CAGR. Smart-city developments and integrated 5G/IoT infrastructure provide key deployment channels.
South Africa
South Africa reaches USD 159.24 million in 2026, equivalent to approximately 11.53% of the country total, and is forecast at USD 525.68 million by 2034. Its 16.10% CAGR is the fastest among the six supplied countries.
Egypt
Egypt accounts for approximately 8.36% of the 2026 country total at USD 115.46 million. The country is projected to reach USD 368.96 million by 2034, registering a strong 15.63% CAGR across the forecast period.
Turkey
Turkey represents approximately 7.39% in 2026 with USD 102.05 million, increasing to USD 309.16 million by 2034 at 14.86% CAGR. Deployment opportunities span road lighting, connected public spaces and telecommunications infrastructure.
Nigeria
Nigeria contributes approximately 6.25% of the 2026 country total, valued at USD 86.36 million. It is forecast to reach USD 263.99 million by 2034, registering a 14.99% CAGR.
Top players in Middle East and Africa Smart Pole Market
- Signify Holding N.V.
- Huawei Technologies Co., Ltd.
- Ericsson AB
- Nokia Corporation
- Itron Inc.
- Schréder Group
- Telensa Ltd.
- Valmont Industries Inc.
- Ubicquia Inc.
- Cisco Systems Inc.
- ENE.HUB Pty Ltd.
- CIMCON Lighting
- Sunna Design
- Omniflow SA
- Shanghai Sansi Electronic Engineering Co., Ltd.
Top Two Companies
-
Signify Holding N.V. Competitive positioning
Publicly verifiable Middle East and Africa company-specific revenue percentage is not available from the supplied dataset, so an unsupported share is not assigned. Signify maintains strong positioning through connected lighting and smart-city management technologies, combining luminaires, controls and software within integrated urban-lighting architecture. Its competitive relevance is strongest where municipal customers require lighting modernization alongside centralized management, sensing and digital services. The competitive field includes more than 10 major international smart-infrastructure suppliers, making ecosystem compatibility, energy efficiency, software capabilities and lifecycle services important differentiators.
-
Huawei Technologies Co., Ltd. Competitive positioning
No validated regional percentage is provided in the mandatory tables; therefore, a company-level share is not fabricated. Huawei's positioning is strengthened by integration across 5G-A, Wi-Fi 7, AI, IoT and cloud computing. Its February 2025 KAFD agreement specifically included smart-pole solutions across a 1.6-million-square-meter development in Riyadh, demonstrating the company's ability to connect poles with broader telecommunications and smart-city platforms rather than supplying standalone lighting infrastructure.
Recent Developments in Middle East and Africa Smart Pole Market
- 2025: KAFD and Huawei signed an MoU covering smart-city solutions, AI, Wi-Fi 7, 5G-A, IoT, cloud computing and smart poles across KAFD's 1.6-million-square-meter development in Riyadh.
- 2025: Dubai RTA completed Phase Two of its smart pedestrian signal expansion, adding 10 locations and increasing total coverage from 17 to 27 sites.
- 2025: DEWA reported continued digital-network modernization through its Distribution Network Smart Centre, integrating 3 major smart initiatives covering advanced metering, distributed solar and EV charging infrastructure.
- 2026: Riyadh Municipality published updated road and lighting-pole datasets covering 3 lighting technologies—halogen, LED and solar-powered streetlights—supporting data-driven planning for municipal lighting modernization.
Research Methodology
The study applies a structured top-down and bottom-up methodology using 2025 as the base year, 2026 as the current year, 2022–2024 as historical years, and 2026–2034 as the forecast period. Mandatory supplied tables were treated as the primary numerical source for country and offering values, shares and CAGR calculations. The analysis covers 6 quantified countries, 3 quantified offerings, 2 installation types, 3 applications, 2 connectivity groups, and 2 material groups. Secondary evidence from government, municipal and industry sources was used for technology, deployment and competitive context; where segment-level or company-level numerical data were not supplied or independently validated, no market values, CAGR figures or company percentages were fabricated.
Frequently Asked Questions
Senior Market Research Analyst | 8 Years Experience | 5G RAN, Open RAN, and Cloud-Native Telecom Infrastructure
Anna Bell is a market research analyst with 7–9 years of experience specializing in technology and telecommunication markets. Contributed to 70+ research reports for global clients. Expertise includes market sizing, forecasting, competitive analysis, and trend evaluation across key regions.