India Smart Pole Market Size
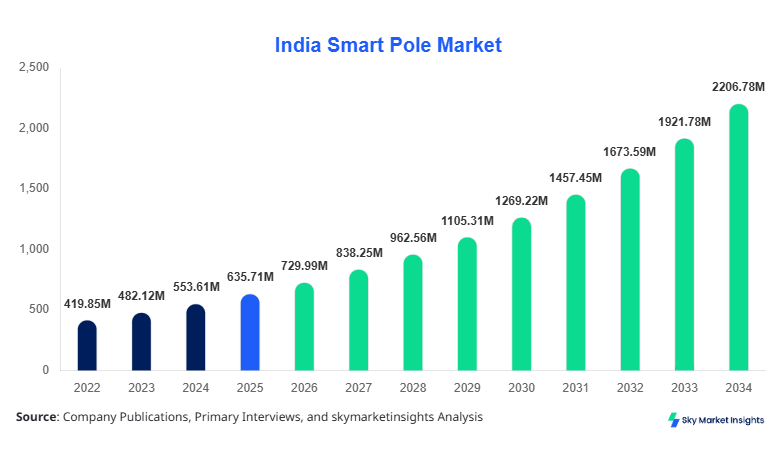
India Smart Pole Market size is projected at USD 729.99 million in 2026 and is expected to hit USD 2,206.10 million by 2034 with a CAGR of 14.83%. The market advances from USD 635.74 million in 2025, representing approximately 14.8% year-on-year expansion into 2026. Assessment of offerings, installation models, connectivity, applications, materials, procurement activity, and competitive positioning is essential for evaluating deployment economics and the evolving vendor landscape.
Key Takeaways
- Hardware dominates offerings with USD 328.63 million in 2026, equivalent to approximately 45.0% of the total, and reaches USD 992.76 million by 2034 at 14.82% CAGR.
- Software is the fastest-growing offering at 14.83% CAGR, increasing from USD 220.46 million in 2026 to USD 666.46 million by 2034.
- New installation dominates installation type with USD 439.62 million in 2026, approximately 60.2% of the installation-type total, and reaches USD 1,330.85 million by 2034 at 14.85% CAGR.
- Retrofit installation accounts for approximately 39.8% in 2026 and rises from USD 290.42 million to USD 876.74 million by 2034 at 14.81% CAGR.
- Regional market shares are not quantified in the supplied dataset; nationally, 5G coverage reached 99.9% of Indian districts and 5.18 lakh 5G BTS were installed by December 2025.
Smart poles are multifunctional urban infrastructure integrating LED illumination, sensors, communications equipment, controllers, surveillance and software-managed services. Hardware contributed approximately 45.0% of the USD 729.99 million 2026 total, while software represented 30.2% and services 24.8%. New installations represented approximately 60.2% of the installation market. Adoption is supported by India's communications infrastructure: 5.18 lakh 5G BTS were operating by December 2025, with 5G available across 99.9% of districts.
Explore more data points, trends and opportunities Download Free Sample Report
India Smart Pole Market Trends
Convergence of Lighting, Sensors and 5G Infrastructure
Urban poles are shifting from single-purpose lighting assets toward connected infrastructure supporting LED lighting, environmental sensors, CCTV, Wi-Fi and cellular equipment. India's 5G network expanded from 4.69 lakh BTS in February 2025 to 4.86 lakh in June 2025 and 5.18 lakh by December 2025, while district coverage advanced from 99.6% to 99.9%.
Municipal deployments increasingly emphasize centralized monitoring and adaptive illumination. Ahmedabad's proposed modernization covers more than 2.1 lakh streetlight poles, incorporates 5,000 new poles and carries an estimated INR 500 crore five-year tender value. NDMC's deployment demonstrates multifunctionality through 55 smart poles incorporating LED lighting, air sensors and Wi-Fi, alongside safety infrastructure covering 43 school buildings and 16 metro stations.
India Smart Pole Market Drivers
Rapid 5G Densification and Digitization of Urban Infrastructure
India's nationwide digital infrastructure expansion is strengthening the business case for multifunctional poles. Between February and December 2025, installed 5G BTS increased from 4.69 lakh to 5.18 lakh, a rise of approximately 10.4%, while coverage expanded from 99.6% to 99.9% of districts. Smart poles can accommodate communications, lighting and sensing equipment within consolidated roadside infrastructure, while municipal projects involving 55 connected poles, 43 school locations and 16 metro stations demonstrate the multi-service deployment model.
India Smart Pole Market Restraints
High Integration Complexity and Municipal Capital Requirements
Large-scale modernization requires substantial capital, systems integration and long-term maintenance commitments. Ahmedabad's proposed five-year smart streetlighting program is valued at approximately INR 500 crore and covers more than 2.1 lakh existing poles plus 5,000 new poles. Requirements spanning command-center integration, automated fault detection, power monitoring and scheduled illumination increase implementation complexity compared with conventional lighting replacement, while service-level expectations can require repairs within 24 hours on main roads and 48 hours on smaller roads.
India Smart Pole Market Opportunities
Conversion of Street Furniture into Connected Digital Nodes
The opportunity extends beyond illumination toward telecom densification, public safety and environmental sensing. By December 2025, 5.18 lakh 5G BTS supported connectivity across 99.9% of Indian districts, compared with 4.69 lakh BTS and 99.6% coverage in February 2025. NDMC's 55-pole deployment combines Wi-Fi, air sensors and LED lighting, while 360-degree CCTV systems can capture footage across ranges of up to 100 meters, illustrating the potential for integrated municipal infrastructure.
Challenges in India Smart Pole Market
Interoperability, Maintenance and Lifecycle Management
Smart poles combine multiple hardware and communications layers, increasing requirements for interoperability and continuous maintenance. A single municipal program may connect more than 2.1 lakh lighting assets to centralized monitoring while simultaneously managing 5,000 new poles. As national 5G infrastructure exceeds 5.18 lakh BTS and coverage approaches 99.9% of districts, cities must coordinate lighting, fiber, cellular equipment, sensors and command platforms without compromising uptime or creating fragmented technology architectures.
Report Scope
| Report Metric | Details |
|---|---|
| Market Size in 2025 | USD 635.74 Million |
| Market Size in 2026 | USD 729.99 Million |
| Market Size in 2034 | USD 2206.1 Million |
| CAGR | 14.83% (2026-2034) |
| Base Year for Estimation | 2025 |
| Historical Data | 2022-2024 |
| Forecast Period | 2026-2034 |
| Report Coverage | Revenue Forecast, Competitive Landscape, Supply Chain Disruption, Growth Factors, Environment & Regulatory Landscape and Trends |
Explore more data points, trends and opportunities Download Free Sample Report
India Smart Pole Market Segmentation
The market is segmented by offerings, installation type, application, connectivity technology and material. Based on supplied numerical data, hardware represents approximately 45.0% of 2026 offerings, while new installations account for approximately 60.2% of installation-type revenue.
By Offerings
Hardware is the largest offering, increasing from USD 286.21 million in 2025 to USD 328.63 million in 2026 and USD 992.76 million by 2034 at 14.82% CAGR. It represents approximately 45.0% of 2026 revenue, reflecting spending on poles, luminaires, sensor modules, communication devices and controllers.
Software rises from USD 191.99 million in 2025 to USD 220.46 million in 2026 and USD 666.46 million by 2034 at 14.83% CAGR. Services also record 14.83% CAGR, moving from USD 180.90 million in 2026 to USD 546.88 million by 2034, making software and services the joint fastest-growing offerings by supplied CAGR.
By Installation Type
New installation is the dominant category, valued at USD 382.78 million in 2025 and USD 439.62 million in 2026 before reaching USD 1,330.85 million in 2034. Its 14.85% CAGR is also the highest within installation type, and the category represents approximately 60.2% of 2026 revenue.
Retrofit installation increases from USD 252.96 million in 2025 to USD 290.42 million in 2026 and USD 876.74 million by 2034 at 14.81% CAGR. Consequently, retrofit accounts for approximately 39.8% of 2026 installation revenue versus approximately 60.2% for new deployments.
By Application, Connectivity Technology and Material
Applications comprise highways and roadways, public places, and railways and harbors; connectivity comprises cellular 4G/5G/NB-IoT and Wi-Fi/Zigbee/Bluetooth/fiber/PLC; materials comprise metallic and composite structures. Numerical subsegment revenue and CAGR figures were not supplied for these classifications and therefore are not estimated or substituted.
India Smart Pole Market Segmentations
By Offerings
- Hardware (poles, luminaires, sensor modules, communication devices, controllers)
- Software (management, analytics platforms)
- Services (installation, maintenance)
By Installation Type
- New Installation
- Retrofit Installation
By Application
- Highways and Roadways
- Public Places (parks, plazas)
- Railways and Harbors
By Connectivity Technology
- Cellular (4G/5G/NBIoT)
- Wi-Fi, Zigbee, Bluetooth, Fiber, PLC
By Material
- Metallic (steel, aluminum)
- Composite (emerging lightweight materials)
India Smart Pole Market Outlook
Regional revenue shares are not provided in the mandatory dataset and therefore cannot be reliably allocated among North, South, West, East or Central India. Available deployment evidence nevertheless indicates adoption across major urban centers. North India includes NDMC's 55 smart poles in Connaught Place, with connected safety infrastructure around 43 school buildings and 16 metro stations.
Western India is demonstrating large-scale modernization potential through Ahmedabad's plan covering more than 2.1 lakh streetlight poles and 5,000 additional poles under an approximately INR 500 crore program. At the national level, 5G connectivity reached 99.9% of districts with 5.18 lakh BTS by December 2025, creating communications infrastructure that can support smart-pole deployment across multiple regions.
Top players in India Smart Pole Market
- Valmont Structures Pvt. Ltd.
- Signify
- Bajaj Electricals Limited
- Wipro Lighting
- Havells India Limited
- Schneider Electric
- Siemens
- Cisco Systems
- Ericsson
- Nokia
- Honeywell
- Larsen & Toubro
- Tata Communications
- HFCL Limited
- Tejas Networks
Top Companies
-
Valmont Structures Pvt. Ltd.
Publicly verifiable India-specific revenue share for smart poles is not disclosed, so assigning a percentage would be speculative. Valmont offers purpose-built multifunctional smart poles in India using a plug-and-play architecture intended to accommodate additional features over the infrastructure lifecycle. Its positioning is supported by configurable urban structures combining physical pole infrastructure with expandable smart-city functionality. The addressable national environment includes 5.18 lakh 5G BTS and 99.9% district-level 5G availability, while hardware itself represents approximately 45.0% of supplied 2026 market revenue.
Recent Developments in India Smart Pole Market
- 2026: India reported 5.18 lakh installed 5G BTS as of December 31, 2025, with 5G services available across 99.9% of districts, strengthening the connectivity foundation for connected street infrastructure.
- 2025: Ahmedabad Municipal Corporation moved toward an INR 500 crore, five-year smart streetlight program covering more than 2.1 lakh poles and adding 5,000 new poles.
- 2025: India's installed 5G BTS base reached 4.86 lakh by June 30, with service available in 99.8% of districts.
- 2025: By February 28, India had deployed 4.69 lakh 5G BTS and achieved 99.6% district coverage, demonstrating rapid densification of connected infrastructure.
Research Methodology
The assessment uses 2025 as the base year, 2026 as the current year, 2022–2024 as the historical period and 2026–2034 as the forecast horizon. Mandatory supplied tables are the primary source for all market revenue, segment contribution and CAGR calculations: USD 635.74 million in 2025, USD 729.99 million in 2026 and USD 2,206.10 million in 2034 at 14.83% CAGR. Secondary evidence is limited to public government, municipal and company information used to contextualize deployment, technology and competitive activity; unsupported regional or company revenue shares are not fabricated.
Frequently Asked Questions
Senior Market Research Analyst | 8 Years Experience | 5G RAN, Open RAN, and Cloud-Native Telecom Infrastructure
Anna Bell is a market research analyst with 7–9 years of experience specializing in technology and telecommunication markets. Contributed to 70+ research reports for global clients. Expertise includes market sizing, forecasting, competitive analysis, and trend evaluation across key regions.