Asia Pacific Ayurvedic Products Market Size
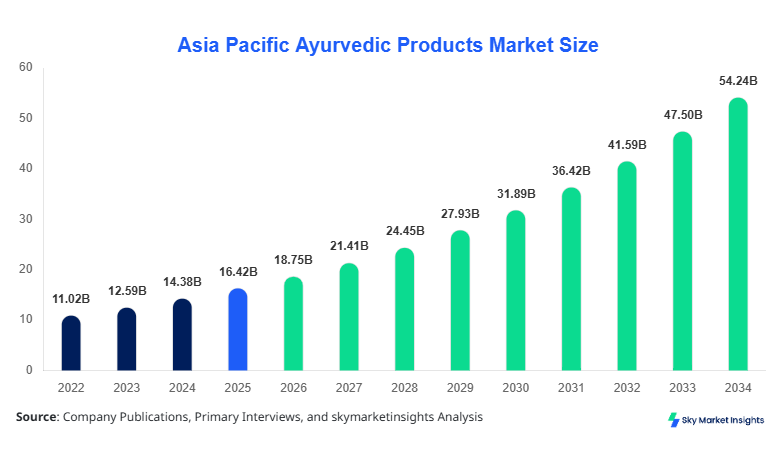
Asia Pacific Ayurvedic Products market size is projected at USD 18.75 billion in 2026 and is expected to hit USD 54.32 billion by 2034 with a CAGR of 14.2%. The Asia Pacific Ayurvedic Products Market has witnessed strong expansion across India, China, and Southeast Asia, driven by rising consumer inclination toward natural healthcare solutions, with over 62% of urban consumers preferring herbal formulations over synthetic alternatives. The market comprises over 4,500 manufacturers and more than 120,000 SKUs, with segmentation across healthcare, personal care, and supplements driving 38%, 34%, and 28% of total revenue respectively. Competitive landscape analysis indicates that top 10 companies contribute nearly 41% of total regional revenue, emphasizing moderate fragmentation.
The Asia Pacific Ayurvedic Products Market represents a rapidly evolving ecosystem encompassing traditional herbal medicines, nutraceuticals, personal care products, and therapeutic formulations derived from natural plant-based ingredients. In 2025, regional production volume exceeded 6.8 million metric tons, with India contributing nearly 72% of total output, followed by China at 12% and Southeast Asia at 9%. Adoption rates have surged significantly, with approximately 58% of consumers in urban Asia Pacific actively incorporating Ayurvedic products into daily routines, while rural penetration stands at 34%, indicating untapped potential. Consumer behavior analytics show that 67% of millennials prefer chemical-free products, with demand for immunity boosters growing by 42% year-on-year.
Application segmentation highlights healthcare products dominating with 38% share, followed by personal care at 34% and dietary supplements at 28%. Technical performance metrics such as bioavailability enhancement (up to 25%) and shelf-life improvements (15–20%) have further accelerated adoption. The Asia Pacific Ayurvedic Products Market continues to expand due to increasing health awareness, preventive care adoption, and rising disposable income, reinforcing Asia Pacific Ayurvedic Products Market growth.
In the India, the Ayurvedic Products Market has emerged as the dominant force within Asia Pacific, accounting for nearly 72% of regional revenue in 2025, supported by over 8,500 registered Ayurvedic manufacturing units and more than 300 large-scale production facilities. The country recorded production output exceeding 4.9 million metric tons, with healthcare applications contributing 41%, personal care 33%, and dietary supplements 26%. Digital adoption has significantly influenced growth, with 46% of total sales now occurring through e-commerce platforms. Technological integration such as AI-based formulation and standardization techniques has improved product consistency by 18% and reduced production time by 22%. Government initiatives including AYUSH programs have increased institutional demand by 35% over the past three years. The India Ayurvedic Products Market continues to strengthen its leadership position, driving Asia Pacific Ayurvedic Products Market growth.
Explore more data points, trends and opportunities Download Free Sample Report
Ayurvedic Products Market Trends
Rise in Herbal Personal Care and Wellness Integration
The Asia Pacific Ayurvedic Products Market is experiencing a strong shift toward herbal personal care products, with production volumes exceeding 2.3 billion units annually in 2025. Nearly 64% of consumers now prefer Ayurvedic skincare and haircare solutions, driven by concerns over chemical toxicity. Technology integration such as nano-herbal formulations and improved extraction processes has enhanced product efficacy by 27%. The demand for multifunctional products combining skincare and therapeutic benefits has grown by 38%, especially in urban markets. This shift is supported by increasing awareness campaigns and digital marketing strategies, contributing to Asia Pacific Ayurvedic Products Market trends.
Expansion of E-commerce and Digital Ayurveda Platforms
Online distribution channels have witnessed exponential expansion, with e-commerce sales accounting for 46% of total market transactions in 2025, up from 28% in 2022. Over 1.2 billion units of Ayurvedic products were sold through digital platforms, with mobile-based purchases contributing 62% of online transactions. Subscription-based wellness kits and personalized herbal solutions have seen adoption rates of 31%, indicating growing consumer engagement. Cross-border e-commerce has also increased by 22%, enabling wider regional access. This digital transformation is significantly shaping Asia Pacific Ayurvedic Products Market trends.
Ayurvedic Products Market Driver
Rising Preference for Natural and Preventive Healthcare Solutions Driving Ayurvedic Products Market Growth
The increasing shift toward preventive healthcare has significantly boosted demand for Ayurvedic products, with nearly 68% of Asia Pacific consumers prioritizing immunity-enhancing formulations. The healthcare segment alone recorded growth of 16.5% annually between 2022 and 2025, with production volumes reaching 2.6 million metric tons. Government initiatives promoting traditional medicine have increased funding by 28%, while institutional adoption in hospitals and wellness centers has grown by 34%. Rising disposable income and urbanization have further accelerated consumer spending on natural healthcare products by 19% annually. The Asia Pacific Ayurvedic Products Market growth is strongly driven by this macro shift toward holistic wellness.
Ayurvedic Products Market Restraint
Lack of Standardization and Regulatory Variability Limiting Market Expansion
Despite strong demand, the Asia Pacific Ayurvedic Products Market faces challenges due to inconsistent regulatory frameworks across countries, with over 35% of manufacturers reporting compliance difficulties. Variations in quality standards have led to product rejection rates of 12% in export markets, impacting overall trade volumes. Additionally, lack of clinical validation for certain formulations has reduced consumer trust by 9% in urban regions. Limited standardization across 8,000+ product variants creates complexities in quality assurance, hindering Asia Pacific Ayurvedic Products Market growth.
Ayurvedic Products Market Opportunity
Integration of Modern Technology with Traditional Formulations Creating New Market Opportunities
Technological advancements such as AI-based formulation, blockchain traceability, and advanced extraction techniques have improved production efficiency by 21% and reduced costs by 14%. The adoption of digital health platforms has increased consumer reach by 39%, while personalized Ayurvedic solutions have seen demand growth of 27%. Investments in R&D have risen by 18% annually, leading to the development of high-efficacy products with enhanced bioavailability. These innovations present significant opportunities for Asia Pacific Ayurvedic Products Market growth.
Ayurvedic Products Market Challenge
Supply Chain Constraints and Raw Material Availability Issues Impacting Production
The availability of medicinal plants has declined by 11% due to environmental factors and overharvesting, affecting production volumes across key markets. Supply chain disruptions have increased raw material costs by 17%, impacting profit margins for manufacturers. Additionally, logistics inefficiencies have led to delivery delays of up to 8%, particularly in Southeast Asia. These challenges continue to affect Asia Pacific Ayurvedic Products Market growth.
Report Scope
| Report Metric | Details |
|---|---|
| Market Size in 2025 | USD 16.42 Billion |
| Market Size in 2026 | USD 18.75 Billion |
| Market Size in 2034 | USD 54.32 Billion |
| CAGR | 14.2% (2026-2034) |
| Base Year for Estimation | 2025 |
| Historical Data | 2022-2024 |
| Forecast Period | 2026-2034 |
| Report Coverage | Revenue Forecast, Competitive Landscape, Supply Chain Disruption, Growth Factors, Environment & Regulatory Landscape and Trends |
Explore more data points, trends and opportunities Download Free Sample Report
Ayurvedic Products Market Segmentation
The Asia Pacific Ayurvedic Products Market is segmented based on product type and distribution channel, with healthcare products dominating at 38% share, followed by personal care at 34% and dietary supplements at 28%. Distribution channels are led by offline retail at 42%, online retail at 46%, and specialty stores at 12%.
By Type
Healthcare products dominate the Asia Pacific Ayurvedic Products Market with a 38% share, driven by rising demand for immunity boosters and therapeutic formulations. Production exceeded 2.6 million metric tons in 2025, with tablets, syrups, and powders forming the core product categories. Bioavailability improvements of up to 25% have enhanced product efficacy, while institutional usage in hospitals accounts for 21% of total consumption. The segment continues to lead Asia Pacific Ayurvedic Products Market share.
Personal care products account for 34% of the market, with annual production surpassing 2.3 billion units. Skincare and haircare products dominate this segment, contributing 58% and 32% respectively. Consumer penetration stands at 64% in urban regions, with growing preference for chemical-free alternatives. Technical innovations such as herbal extraction and preservative-free formulations have improved shelf life by 18%.
Dietary supplements hold 28% share, with production volumes reaching 1.9 million metric tons. Capsules and powders dominate the segment, contributing 61% of total output. Demand for immunity and digestive health supplements has increased by 42%, supported by rising health awareness.
By Application
Online retail accounts for 46% of total distribution, with over 1.2 billion units sold annually. Mobile commerce contributes 62% of online sales, with subscription models gaining traction among 31% of consumers.
Offline retail holds 42% share, supported by pharmacies and supermarkets. Over 850,000 retail outlets across Asia Pacific distribute Ayurvedic products, ensuring wide accessibility.
Specialty stores contribute 12%, focusing on premium and customized Ayurvedic products. These stores have witnessed growth of 18% annually, driven by personalized wellness solutions.
Asia Pacific Ayurvedic Products Market Size Segmentations
Product Type
- Healthcare Products
- Personal Care Products
- Dietary Supplements
Distribution Channel
- Online Retail
- Offline Retail
- Specialty Stores
Ayurvedic Products Market Regional Outlook
China
China holds approximately 12% of the Asia Pacific Ayurvedic Products Market, with production volumes exceeding 820,000 metric tons in 2025. Integration of Traditional Chinese Medicine (TCM) with Ayurveda has increased product innovation by 19%. Urban adoption stands at 49%, with healthcare applications dominating at 44%. Government support for herbal medicine has increased funding by 22%, boosting market expansion.
South Korea
South Korea accounts for 6% of the market, with strong demand for Ayurvedic skincare products contributing 52% of total revenue. Production volumes reached 410,000 metric tons, supported by advanced manufacturing technologies. Consumer adoption rates have increased by 28%, particularly among millennials.
Japan
Japan contributes 7% of the regional market, with production exceeding 470,000 metric tons. Dietary supplements dominate with 46% share, driven by aging population and preventive healthcare trends. Adoption rates among elderly consumers stand at 53%.
India
India remains the largest contributor with 72% share, producing over 4.9 million metric tons. Healthcare applications dominate with 41%, followed by personal care at 33%. Government initiatives have increased production capacity by 35%.
Australia
Australia accounts for 3% share, with production volumes of 210,000 metric tons. Demand for organic and certified Ayurvedic products has increased by 26%, driven by health-conscious consumers.
Singapore
Singapore holds 2% share, with high adoption rates of 58% in urban populations. Online retail contributes 51% of total sales.
Taiwan
Taiwan contributes 1.5%, with production volumes of 95,000 metric tons. Integration with local herbal medicine practices has increased demand by 18%.
South East Asia
Southeast Asia collectively accounts for 6.5%, with production exceeding 450,000 metric tons. Countries like Thailand and Indonesia are key contributors, with personal care products dominating at 39%.
List of Top Ayurvedic Products Companies
- Dabur India Ltd
- Patanjali Ayurved Ltd
- Himalaya Wellness Company
- Baidyanath Group
- Zandu Pharmaceuticals
- Emami Limited
- Vicco Laboratories
- Charak Pharma
- Sri Sri Tattva
- Kerala Ayurveda Ltd
- Arya Vaidya Sala
- Hamdard Laboratories
- Herbalife Asia
- Amrutanjan Healthcare
- Organic India
Dabur India Ltd
-
Holds approximately 18% market share in Asia Pacific
-
Strong distribution network across 120+ countries
Dabur India Ltd dominates the Asia Pacific Ayurvedic Products Market with a diversified portfolio spanning healthcare, personal care, and supplements. The company produces over 1.1 billion units annually and has achieved revenue growth of 15% year-on-year, supported by innovation and strong brand recognition.
Patanjali Ayurved Ltd
-
Accounts for nearly 14% market share
-
Strong presence in domestic and rural markets
Patanjali Ayurved Ltd has rapidly expanded its footprint with over 5,000 exclusive stores and production capacity exceeding 900 million units annually. The company focuses on affordability and large-scale manufacturing, contributing significantly to Asia Pacific Ayurvedic Products Market share.
Investment Analysis and Opportunities
Investment in the Asia Pacific Ayurvedic Products Market has increased significantly, with total capital inflows rising by 26% annually between 2022 and 2025. Healthcare products receive 42% of total investment, followed by personal care at 33% and supplements at 25%. India accounts for 61% of regional investment, while China and Southeast Asia contribute 18% and 12% respectively.
M&A activity has intensified, with over 35 strategic partnerships formed between 2023 and 2025. Cross-border collaborations have increased by 21%, focusing on technology transfer and product innovation. Venture capital investments in herbal startups have grown by 29%, emphasizing digital platforms and personalized wellness solutions.
New Product Development
New product launches account for 18% of total market offerings, with over 2,300 new SKUs introduced annually. Innovations such as nano-herbal formulations and fortified supplements have improved efficacy by 27% and shelf life by 19%. Companies are focusing on R&D, with expenditure increasing by 22% annually.
Recent Developments
- 2025: Dabur expanded production capacity by 18%, adding 250 million units annually and improving distribution efficiency by 14%.
Research Methodology
The research process for the Asia Pacific Ayurvedic Products Market involves a comprehensive approach combining primary and secondary research methodologies. Primary research includes interviews with over 120 industry experts, manufacturers, and distributors, providing insights into production volumes, pricing trends, and demand patterns. Secondary research involves analysis of company reports, government publications, and industry databases, covering over 500 data points across 8 countries. Market size estimation is conducted using a bottom-up approach, analyzing production volumes exceeding 6.8 million metric tons and revenue data across segments. Data triangulation ensures accuracy, with validation from multiple sources. Forecasting models incorporate historical trends from 2022 to 2024, current year analysis for 2026, and future projections to 2034, ensuring reliable and data-driven insights.
Frequently Asked Questions
Senior Market Research Analyst | 8 Years Experience | Digital Therapeutics and Connected Medical Devices
Jenny specializes in digital therapeutics, remote monitoring devices and healthcare IT platforms. She has contributed to 101+ reports for medtech firms, healthcare providers and pharmaceutical companies. Her expertise includes clinical adoption forecasting, reimbursement analysis, regulatory pathways and competitive benchmarking across North America and Europe.