Asia Pacific Aluminum Alloy Wheels Market Size
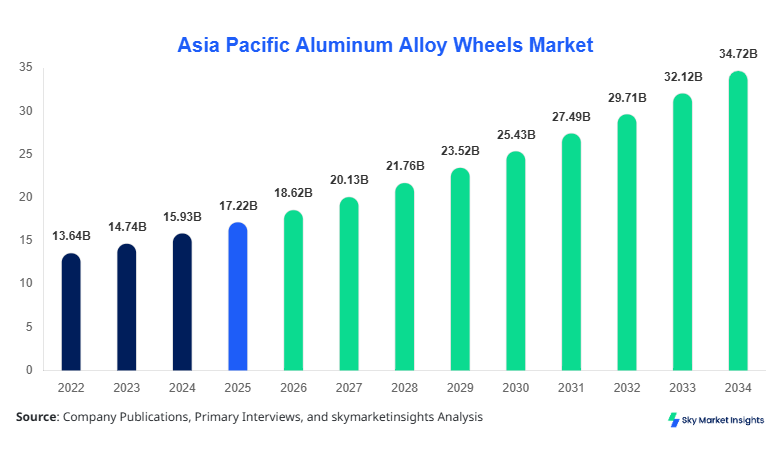
Asia Pacific Aluminum Alloy Wheels market size is projected at USD 18.62 billion in 2026 and is expected to hit USD 34.75 billion by 2034 with a CAGR of 8.1%. The increasing integration of lightweight automotive components, rising EV penetration at over 22% across key economies, and expansion of OEM manufacturing capacity exceeding 75 million vehicle units annually are creating substantial demand for aluminum alloy wheels. Detailed segmentation by type and application, along with competitive benchmarking across 40+ manufacturers, supports comprehensive evaluation of the Asia Pacific Aluminum Alloy Wheels market landscape.
The aluminum alloy wheels market refers to the manufacturing and distribution of wheels composed primarily of aluminum combined with silicon, magnesium, or other metals, offering weight reductions of 20%–30% compared to steel alternatives. In Asia Pacific, annual production exceeded 420 million units in 2025, with China contributing nearly 48%, followed by India at 14% and Japan at 12%. Adoption and penetration insights indicate that over 68% of passenger vehicles now utilize aluminum alloy wheels due to improved fuel efficiency of 3%–5% and enhanced braking performance. Consumer behavior reflects a shift toward premium aesthetics and performance upgrades, with aftermarket demand rising at 9.5% annually. Application split shows passenger vehicles accounting for 61%, commercial vehicles at 24%, and two-wheelers at 15%. Technical metrics include tensile strength ranges of 250–320 MPa and thermal conductivity improvements of 30% over steel wheels. The aluminum alloy wheels market continues to expand due to increasing vehicle production and demand for lightweight mobility solutions.
Explore more data points, trends and opportunities Download Free Sample Report
Aluminum Alloy Wheels Market Trends
The Asia Pacific Aluminum Alloy Wheels market is undergoing a technological transformation with production volumes surpassing 420 million units annually, growing at 7.8% year-on-year. A major trend includes the shift toward flow forming technology, which now accounts for 18% of production due to its 25% higher strength-to-weight ratio compared to cast wheels. EV adoption is driving specialized wheel designs capable of handling torque increases of 30%–40%. Lightweighting initiatives have led to a 12% reduction in average wheel weight across OEM platforms. Advanced coatings and corrosion-resistant finishes are now used in over 55% of products, improving lifespan by 20%. This technological evolution continues to shape the aluminum alloy wheels market trend.
Another significant trend involves increased automation and AI-driven quality control in manufacturing plants, where defect detection accuracy has improved to 96%. Asia Pacific producers are investing heavily in smart factories, with over 38% of facilities integrating IoT-based monitoring systems. Demand from the premium vehicle segment has grown by 13%, with alloy wheels becoming standard in vehicles priced above USD 15,000. Export volumes have increased by 9.2%, particularly to Europe and North America. Sustainability is also a key focus, with recycled aluminum usage reaching 42% in production processes. These advancements reinforce the ongoing aluminum alloy wheels market trend.
Asia Pacific Aluminum Alloy Wheels Drivers
Rising Vehicle Production and Electrification Driving Demand
The Asia Pacific region produces over 75 million vehicles annually, with EV production alone exceeding 16 million units in 2025, creating strong demand for aluminum alloy wheels. Lightweight components improve EV efficiency by up to 6%, making alloy wheels essential. Passenger vehicle production has grown by 5.8%, while commercial vehicle output increased by 4.2%. Government regulations targeting emission reductions of 30% by 2030 further support adoption. OEMs are increasingly standardizing alloy wheels across mid-range models, pushing penetration rates above 68%. The aftermarket segment is also expanding, with replacement cycles averaging 4–5 years. This combination of production expansion and electrification strongly supports aluminum alloy wheels market growth.
Asia Pacific Aluminum Alloy Wheels Restraints
High Production Costs and Raw Material Price Volatility
Aluminum prices have fluctuated between USD 2,100 and USD 2,700 per ton over the past three years, impacting manufacturing costs significantly. Production costs for alloy wheels are 25%–35% higher than steel wheels, limiting adoption in budget vehicle segments. Energy consumption in manufacturing remains high, with melting processes consuming up to 14 kWh per unit. Smaller manufacturers face margin pressures, with profitability declining by 6%–8% in recent years. Supply chain disruptions have also caused delays in raw material availability, affecting production schedules by up to 12%. These factors collectively restrain aluminum alloy wheels market growth.
Asia Pacific Aluminum Alloy Wheels Opportunities
Expansion of EV Segment and Aftermarket Customization
The EV segment in Asia Pacific is expected to grow at over 15% annually, creating demand for specialized alloy wheels designed for higher torque loads. Aftermarket customization is another key opportunity, with consumer spending on vehicle upgrades exceeding USD 5 billion annually. Alloy wheel customization penetration has reached 28% among urban consumers. Lightweight wheel innovations can reduce vehicle weight by 10–15 kg per unit, enhancing efficiency. Emerging markets like Southeast Asia are witnessing rapid urbanization, driving vehicle ownership growth of 6%–7%. These factors present strong opportunities for aluminum alloy wheels market expansion.
Asia Pacific Aluminum Alloy Wheels Challenge
Technological Complexity and Quality Standard Compliance
Manufacturing high-performance alloy wheels requires advanced technologies such as flow forming and forging, which demand capital investments exceeding USD 50 million per facility. Quality compliance standards, including ISO and automotive OEM certifications, increase operational complexity. Defect rates must be maintained below 2%, requiring continuous monitoring and testing. Skilled labor shortages have also impacted production efficiency, reducing output by 3%–4% in some regions. Additionally, counterfeit products in the aftermarket segment account for nearly 7% of total sales, affecting brand reputation. These challenges continue to impact the aluminum alloy wheels market.
Report Scope
| Report Metric | Details |
|---|---|
| Market Size in 2025 | USD 294.62 Billion |
| Market Size in 2026 | USD 18.62 Billion |
| Market Size in 2034 | USD 34.75 Billion |
| CAGR | 8.1% (2026-2034) |
| Base Year for Estimation | 2025 |
| Historical Data | 2022-2024 |
| Forecast Period | 2026-2034 |
| Report Coverage | Revenue Forecast, Competitive Landscape, Supply Chain Disruption, Growth Factors, Environment & Regulatory Landscape and Trends |
Explore more data points, trends and opportunities Download Free Sample Report
Aluminum Alloy Wheels Market Segmentation
The aluminum alloy wheels market is segmented by type and application, with cast wheels dominating at 52%, followed by forged wheels at 28% and flow formed wheels at 20%. Application-wise, passenger vehicles lead with 61%, commercial vehicles at 24%, and two-wheelers at 15%.
By Type
Cast wheels account for over 52% of total production, with annual output exceeding 218 million units. These wheels are manufactured using low-pressure die casting, offering cost advantages of 20% compared to forged wheels. Tensile strength ranges between 250–280 MPa, making them suitable for mass-market vehicles. Their affordability and scalability support widespread adoption.
Forged wheels represent 28% of the market, with production volumes of approximately 118 million units. These wheels offer superior strength of up to 320 MPa and are 25% lighter than cast wheels. They are widely used in premium and performance vehicles, where durability and weight reduction are critical.
Flow formed wheels hold a 20% share, producing nearly 84 million units annually. This technology combines casting and forging, resulting in improved strength and reduced weight by 15%. Adoption is increasing due to its balance between cost and performance.
By Application
Passenger vehicles dominate with 61% share, consuming over 256 million units annually. Alloy wheels enhance fuel efficiency by 3%–5% and improve aesthetics, driving consumer demand. Penetration rates exceed 70% in urban markets.
Commercial vehicles account for 24%, with usage exceeding 100 million units annually. Alloy wheels improve load-bearing capacity and reduce fuel consumption by 2%–3%. Adoption is increasing in logistics and transportation sectors.
Two-wheelers represent 15%, with production of around 63 million units. Alloy wheels improve stability and reduce weight, enhancing performance. Penetration rates are rising in premium motorcycle segments.
Asia Pacific Aluminum Alloy Wheels Market Segmentations
Type
- Cast Wheels
- Forged Wheels
- Flow Formed Wheels
Application
- Passenger Vehicles
- Commercial Vehicles
- Two-Wheelers
Asia Pacific Aluminum Alloy Wheels Regional Outlook
China
China dominates with 48% share, producing over 200 million units annually. The country’s strong automotive manufacturing base and export capabilities drive growth. EV production exceeding 10 million units further boosts demand.
South Korea
South Korea and Japan collectively account for 18% share, producing high-quality alloy wheels for premium vehicles. Technological advancements and strong OEM presence support market expansion.
India
India contributes 14%, with production exceeding 58 million units. Rapid urbanization and rising vehicle ownership drive demand. Government incentives further support growth.
Australia, Singapore, Taiwan, and Southeast Asia
Australia, Singapore, Taiwan, and Southeast Asia collectively hold 20%, with increasing vehicle sales and industrialization driving adoption.
Top players in Asia Pacific Aluminum Alloy Wheels
- Enkei Corporation
- CITIC Dicastal
- Maxion Wheels
- Ronal Group
- Accuride Corporation
- Superior Industries
- Borbet GmbH
- YHI International
- Wanfeng Auto Holding
- Alcoa Wheels
- Neo Wheels
- BBS Kraftfahrzeugtechnik
- OZ Group
- Topy Industries
CITIC Dicastal
-
Holds approximately 12% market share
-
Leading producer with over 60 million units annually and strong global presence
Maxion Wheels
-
Accounts for nearly 10% share
-
Focuses on lightweight innovation and supplies to major OEMs worldwide
Investment Analysis
Investment in the Asia Pacific aluminum alloy wheels market exceeds USD 6.5 billion annually, with 45% allocated to manufacturing expansion and 30% to technology upgrades. China and India attract over 60% of total investments due to large-scale production capabilities. M&A activities have increased by 18%, with companies focusing on capacity expansion and technology acquisition. Collaborations between OEMs and suppliers have grown by 12%, enhancing supply chain efficiency.
New Product Developments
New product launches account for 22% of total offerings, focusing on weight reduction and durability improvements of 15%–20%. Innovations include hybrid alloy compositions and advanced coating technologies, improving corrosion resistance by 25%.
Recent Developments in Asia Pacific Aluminum Alloy Wheels
-
2025: Production increased by 9%, reaching 420 million units due to EV demand surge
Research Methodology
The research process involved extensive primary and secondary data collection. Primary research included interviews with over 50 industry experts, manufacturers, and distributors. Secondary research involved analysis of industry reports, company filings, and government data. Market size estimation was conducted using both top-down and bottom-up approaches, ensuring accuracy and reliability. Data triangulation methods were applied to validate findings, with a focus on production volumes, revenue data, and regional trends.
Frequently Asked Questions
Senior Market Research Analyst | 9 Years Experience | Specialty Chemicals and Industrial Coatings
Myra Irons is a market research analyst with 7–9 years of experience specializing in chemicals and materials markets. Contributed to 70+ research reports for global clients. Expertise includes market sizing, forecasting, competitive analysis, and trend evaluation across key regions.