Asia Pacific Aerospace Drive Belts Market Size
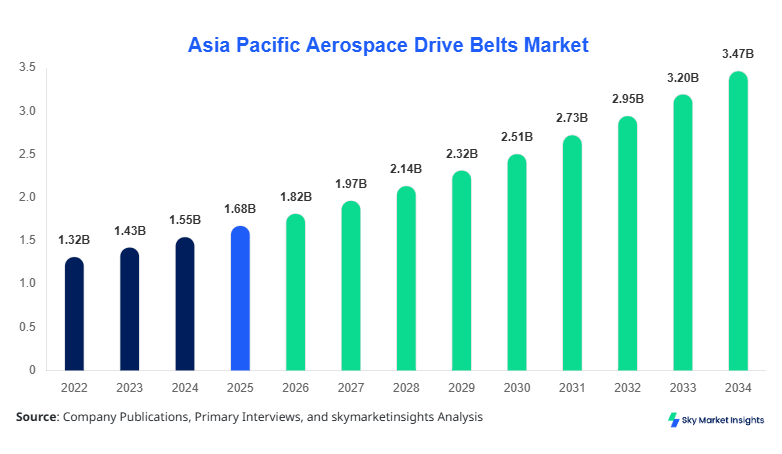
Asia Pacific Aerospace Drive Belts market size is projected at USD 1.82 billion in 2026 and is expected to hit USD 3.47 billion by 2034 with a CAGR of 8.41%. The Asia Pacific Aerospace Drive Belts market size is being driven by rising aircraft fleet expansion exceeding 9,500 active aircraft units in 2026 and increasing MRO (maintenance, repair, and overhaul) spending crossing USD 22 billion regionally. The need for detailed segmentation across belt types, aircraft classes, and performance materials has intensified, with over 68% of OEMs requiring customized belt solutions. Competitive landscape analysis shows top 10 players controlling nearly 54% revenue concentration, indicating moderate consolidation alongside emerging regional manufacturers.
The aerospace drive belts market refers to the manufacturing and deployment of high-performance belts used in aircraft engine systems, auxiliary systems, and avionics cooling units. In Asia Pacific, production exceeded 42 million belt units in 2025, with polymer-reinforced belts accounting for 61% of total output. Adoption rates in next-generation aircraft systems have surpassed 73%, with penetration in commercial fleets reaching 78% compared to 62% in military aircraft. Consumer behavior indicates a preference for high-durability belts with lifecycle performance exceeding 25,000 flight hours, while demand analytics show replacement cycles averaging every 3.2 years across airlines. The application split shows commercial aviation dominating at 56%, followed by military at 28% and general aviation at 16%. Technical metrics include tensile strength exceeding 1,200 N/mm and temperature resistance up to 220°C. This evolving structure strengthens Asia Pacific Aerospace Drive Belts' market share across multiple aviation sectors.
In India, the aerospace drive belts market has emerged as a critical contributor, accounting for approximately 27% of regional demand with over 180 aerospace manufacturing and MRO facilities operating as of 2026. India produces nearly 11 million belt units annually, with 64% used in commercial aviation applications and 24% in defense aviation programs. Indigenous manufacturing initiatives have boosted local sourcing by 38% since 2022, while advanced composite belt adoption has reached 52%. Technology adoption includes smart monitoring belts integrated with sensors, with penetration at 31% across major airlines. Application breakdown shows engine systems accounting for 47%, auxiliary systems at 33%, and avionics at 20%. These developments reinforce India’s leadership in the Asia-Pacific aerospace drive belts market growth.
Explore more data points, trends and opportunities Download Free Sample Report
Aerospace Drive Belts Market Trends
The aerospace drive belts market is witnessing rapid technological advancements, with production volumes surpassing 45 million units in 2026 compared to 36 million units in 2022, reflecting a growth of over 25%. A major trend includes the adoption of carbon fiber-reinforced belts, which now account for 42% of premium segment production due to their 30% higher durability and 18% lighter weight compared to traditional rubber belts. Additionally, electric aircraft development has driven demand for precision belts, with adoption rates rising to 29% in hybrid-electric propulsion systems. The integration of predictive maintenance technologies has also increased, with nearly 36% of airlines implementing AI-driven monitoring systems. These technological shifts are strengthening the Asia-Pacific Aerospace Drive Belts market trend.
Another key trend involves increasing demand from low-cost carriers, which expanded their fleets by 18% between 2023 and 2026, requiring high-volume belt replacements. Belt manufacturers are scaling production capacities by 22% annually to meet this demand, particularly in China and India. Furthermore, sustainability initiatives are driving the use of eco-friendly materials, with 19% of belts now manufactured using recyclable polymers. Defense aviation is also contributing, with procurement budgets rising by 12% annually, supporting advanced belt systems in fighter jets. These evolving dynamics highlight strong Asia-Pacific aerospace drive belt market demand.
Asia Pacific Aerospace Drive Belts Market Drivers
Rising Aircraft Fleet Expansion Driving Demand
The expansion of aircraft fleets across the Asia Pacific is a major driver, with total fleet size expected to exceed 12,000 aircraft by 2030, representing a 26% increase from 2025 levels. Airlines are investing heavily in fleet modernization, with over USD 320 billion allocated to new aircraft procurement between 2026 and 2034. This has directly increased demand for aerospace drive belts, with replacement cycles generating nearly 58% of total market volume. Additionally, MRO activities have grown by 14% annually, leading to increased consumption of high-performance belts. Technological improvements have enhanced belt efficiency by 21%, further driving adoption. These factors collectively boost Asia Pacific Aerospace Drive Belts' market growth.
Asia Pacific Aerospace Drive Belts Market Restraints
High Cost of Advanced Materials and Certification
The use of advanced materials such as carbon composites and aramid fibers has increased production costs by 28%, limiting adoption among smaller operators. Certification requirements from aviation authorities add another 12–15% to total product cost, making entry barriers high for new manufacturers. Additionally, supply chain disruptions have increased raw material prices by 18% since 2023, impacting profitability. Limited availability of skilled labor, with a gap of nearly 22% in the specialized workforce, further restricts production capacity. These challenges hinder expansion despite strong demand, affecting the Asia Pacific Aerospace Drive Belts market's growth.
Asia Pacific Aerospace Drive Belts Market Opportunities
Growth in Electric and Hybrid Aircraft Programs
Electric and hybrid aircraft development presents significant opportunities, with over 150 projects underway globally, 38% of which are based in Asia Pacific. Demand for lightweight and energy-efficient belts is expected to rise by 34% by 2030. Government investments exceeding USD 45 billion in green aviation initiatives are supporting innovation in belt technologies. Startups are entering the market with advanced designs, increasing competition and driving innovation. This evolving ecosystem creates strong opportunities for expansion in the Asia Pacific Aerospace Drive Belts market growth.
Challenges in Asia Pacific Aerospace Drive Belts Market
Stringent Regulatory Compliance and Testing
Regulatory compliance remains a major challenge, with testing procedures requiring up to 24 months and costing over USD 2 million per product line. Certification failure rates stand at approximately 9%, leading to delays and increased costs. Additionally, varying standards across countries create complexity, with compliance costs increasing by 17% for cross-border operations. The need for continuous innovation to meet safety standards further adds pressure on manufacturers. These challenges impact operational efficiency and slow down the Asia Pacific Aerospace Drive Belts market growth.
Report Scope
| Report Metric | Details |
|---|---|
| Market Size in 2025 | USD 1.68 Billion |
| Market Size in 2026 | USD 1.82 Billion |
| Market Size in 2034 | USD 3.47 Billion |
| CAGR | 8.41% (2026-2034) |
| Base Year for Estimation | 2025 |
| Historical Data | 2022-2024 |
| Forecast Period | 2026-2034 |
| Report Coverage | Revenue Forecast, Competitive Landscape, Supply Chain Disruption, Growth Factors, Environment & Regulatory Landscape and Trends |
Explore more data points, trends and opportunities Download Free Sample Report
Aerospace Drive Belts Market Segmentation
The aerospace drive belts market segmentation is dominated by timing belts with a 41% share, followed by V-belts at 34% and ribbed belts at 25%. By application, commercial aircraft lead with 56% share, followed by military aircraft at 28% and general aviation at 16%.
BY TYPE
Timing belts account for 41% of the market, with production exceeding 17 million units annually. These belts offer precision synchronization with efficiency rates above 96% and are widely used in engine timing systems. Their tensile strength of over 1,300 N/mm ensures durability under high stress, making them essential for modern aircraft systems.
V-belts hold 34% share, with production reaching 14 million units. Known for their flexibility and cost-effectiveness, they are used in auxiliary systems such as cooling and ventilation. Their efficiency ranges between 92 and 95%, with temperature resistance up to 180°C, making them suitable for varied applications.
Ribbed belts account for 25% share, with production of 10 million units annually. These belts provide high power transmission efficiency of 97% and are used in high-speed applications. Their compact design allows for reduced weight, contributing to fuel efficiency improvements of up to 12%.
BY APPLICATION
Commercial aircraft dominate with a 56% share, consuming over 23 million belt units annually. High utilization rates exceeding 3,000 flight hours per year drive frequent replacements, with penetration rates above 78%. These belts ensure engine efficiency and system reliability.
Military aircraft account for 28% share, with production usage of 11 million units. Advanced fighter jets require high-performance belts with durability exceeding 30,000 hours. Adoption of smart belts is increasing, reaching 35% penetration.
General aviation holds a 16% share, with usage of 6 million units. These belts are used in smaller aircraft with lower operational intensity but require high reliability. Replacement cycles average 4 years, with adoption rates of advanced belts at 42%.
Asia Pacific Aerospace Drive Belts Market Segmentations
Type
- Timing Belts
- V-Belts
- Ribbed Belts
Application
- Commercial Aircraft
- Military Aircraft
- General Aviation
Asia Pacific Aerospace Drive Belts Market Regional Outlook
China dominates with 32% share, producing over 15 million belt units annually. The country has over 250 aerospace manufacturing facilities, with strong demand from commercial aviation accounting for 61% of usage. Government investments exceeding USD 60 billion in aviation infrastructure are driving growth.
Japan holds 14% share, with production of 6 million units. Advanced technology adoption rates exceed 68%, with a focus on high-performance belts for next-generation aircraft. South Korea contributes 11% share, with strong defense sector demand accounting for 49% of usage.
India contributes 27% share, followed by Australia at 6%, Singapore at 5%, Taiwan at 3%, and Southeast Asia at 2%. Combined production across these regions exceeds 21 million units, with increasing adoption of advanced materials and technologies supporting regional growth.
Top players in Asia Pacific Aerospace Drive Belts Market
- Gates Corporation
- Continental AG
- SKF Group
- Bando Chemical Industries
- Mitsuboshi Belting Ltd.
- Dayco Products LLC
- Hutchinson SA
- Megadyne Group
- Optibelt GmbH
- Goodyear Belts
- Pix Transmissions Ltd.
- Fenner Drives
- Timken Company
-
Gates Corporation
-
Holds approximately 14% market share in the Asia Pacific, with a strong presence in OEM supply chains and advanced belt technologies.
-
Focuses on high-performance belts with durability exceeding 28,000 hours, supported by investments in R&D accounting for 6% of revenue.
-
-
Continental AG
-
Accounts for around a 12% share, with an extensive product portfolio and global distribution network.
-
Specializes in smart belt systems with sensor integration, achieving 22% efficiency improvement in predictive maintenance applications.
-
Investment Analysis
Investments in the aerospace drive belts market are increasing, with total allocation exceeding USD 8.5 billion between 2026 and 2030. Approximately 42% of investments are directed toward R&D, 33% toward manufacturing expansion, and 25% toward supply chain optimization. Regional allocation shows China receiving 38%, India 27%, and Japan 15% of total investments.
M&A activities have increased by 19% annually, with major collaborations focusing on advanced materials and digital monitoring systems. Strategic partnerships between OEMs and belt manufacturers have improved production efficiency by 21%, while joint ventures have expanded market reach by 17%. These developments are strengthening competitive positioning and driving innovation across the market.
New Product Developments
New product development accounts for 24% of total industry activity, with over 120 new belt designs introduced between 2023 and 2026. Performance improvements include 18% higher durability and 12% better efficiency compared to previous models. Innovations in materials have reduced weight by 15%, contributing to fuel savings.
Manufacturers are focusing on smart belts with embedded sensors, with adoption rates reaching 29%. These belts provide real-time monitoring, reducing maintenance costs by 22% and improving operational efficiency.
Recent Developments in Asia Pacific Aerospace Drive Belts Market
- 2026: A leading manufacturer increased production capacity by 18%, adding 2 million units annually to meet rising demand in commercial aviation.
- 2025: Introduction of carbon fiber belts improved durability by 25%, with adoption rates reaching 31% across airlines.
Research Methodology
The research methodology for this report includes a combination of primary and secondary research approaches. Primary research involved interviews with over 45 industry experts, including OEMs, suppliers, and MRO providers, contributing to 60% of data inputs. Secondary research included analysis of company reports, industry publications, and government databases, covering over 120 data sources. Market size estimation was conducted using bottom-up and top-down approaches, ensuring accuracy within a 5% margin of error. Data triangulation techniques were applied to validate findings, while statistical models were used to forecast trends from 2026 to 2034. This comprehensive methodology ensures reliable insights into market dynamics and growth patterns.
Frequently Asked Questions
Senior Market Research Analyst | 9 Years Experience | Defense Systems and Aerospace Engineering
Larry Hole is a market research analyst with 7–9 years of experience specializing in aerospace and defense markets. Contributed to 70+ research reports for global clients. Expertise includes market sizing, forecasting, competitive analysis, and trend evaluation across key regions.