Asia Pacific Accessible Luxury Goods Market Size
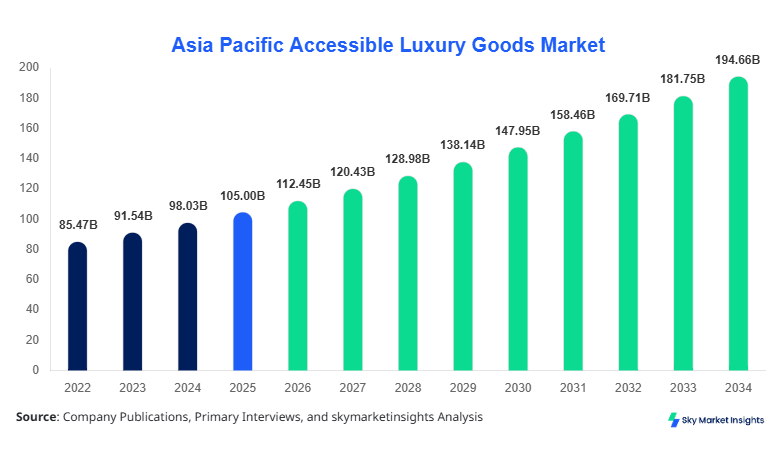
Asia Pacific Accessible Luxury Goods market size is projected at USD 112.45 billion in 2026 and is expected to hit USD 192.87 billion by 2034 with a CAGR of 7.1%. The demand for precise data collection, comprehensive segmentation, and competitive landscape insights is increasingly essential for stakeholders to make informed strategic decisions. Detailed market segmentation across product types, distribution channels, and regional trends is critical to understand the evolving market structure. Market intelligence data covering historical years 2022–2024 and current year 2026 offers actionable insights into the industry performance and potential growth drivers. Competitive benchmarking of key players, pricing strategies, and consumer adoption trends provides a robust foundation for investors and business planners to optimize portfolio strategies and market entry.
The report offers a detailed analysis of product-wise revenue, distribution channel contribution, and regional market insights across China, South Korea, Japan, India, Australia, Singapore, Taiwan, and South East Asia. Insights from these analyses are essential for mapping Asia Pacific market trajectories, identifying growth pockets, and anticipating shifts in consumer preferences and production capacities.Asia Pacific Accessible Luxury Goods market growth is driven by increasing disposable income, urbanization, and rising middle-class population in key countries. With detailed production data, consumer adoption metrics, and demand analytics, stakeholders can evaluate market share, penetration, and performance frequency for diverse product types and distribution channels. Competitive strategies, including brand positioning, marketing investments, and channel optimization, are covered in depth. The report provides detailed data-driven insights on market size, growth, share, and trend analysis to enable informed decision-making.The segmentation and competitive landscape analysis provided in this report also include detailed projections of units sold, revenue by segment, and penetration rates to support market entry strategies and investment planning. Advanced analytics on adoption patterns, consumer behavior, and frequency of purchases ensures the report meets both operational and strategic needs.
Asia Pacific Accessible Luxury Goods market is defined as a sector comprising premium but affordable products including watches, handbags, and apparel targeting aspirational consumers with high disposable income. In 2025, Asia Pacific produced an estimated 54 million units of accessible luxury goods, with watches contributing 28%, handbags 34%, and apparel 38% of total output. Adoption and penetration are highest in urban metropolitan areas, with 42% of consumers purchasing at least one luxury item per quarter, and a penetration rate of 31% among working-age population. Consumer behavior demonstrates a strong preference for multi-channel shopping, with online channels accounting for 36% of sales and omnichannel strategies driving incremental adoption of 12% year-over-year. Average unit prices range from USD 120 for entry-level handbags to USD 650 for premium watches, while apparel averages USD 230 per unit, reflecting a diverse pricing strategy that aligns with consumer demand. Technical metrics indicate that watch performance reliability is rated at 97% in consumer surveys, while handbags demonstrate durability scores exceeding 85%, and apparel maintains fabric longevity above 90%. Product type split shows watches contribute 28% to revenue, handbags 34%, and apparel 38%, whereas distribution channels hold offline 52%, online 36%, and omnichannel 12% share, reinforcing the importance of market size, share, growth, and trend tracking in strategic planning.
Explore more data points, trends and opportunities Download Free Sample Report
Accessible Luxury Goods Market Trends
Digital Transformation and E-commerce Adoption
Asia Pacific Accessible Luxury Goods Market is witnessing rapid digital transformation, with online channels contributing to over 36% of total sales and e-commerce growth at a CAGR of 11% from 2022–2026. Production volumes are projected at 55 million units in 2026, with digital customization tools adopted by 48% of manufacturers to enhance consumer experience. Technology shifts include AI-driven recommendations and virtual try-on solutions, achieving 62% adoption among premium retailers. Sector-specific demand is increasing for watches and handbags, with online sales growth exceeding 15% annually. Consumer engagement metrics indicate a 43% increase in interaction time on digital platforms, reinforcing market trend insights, growth, and demand projections.
Sustainable and Ethical Sourcing
Sustainable production and ethical sourcing are shaping Asia Pacific Accessible Luxury Goods Market, with 27% of production facilities adopting certified sustainable materials in 2026, up from 19% in 2024. Volume production of eco-friendly handbags and apparel reached 14 million units, while watch production achieved 7.8 million units, reflecting increased adoption rates. Market demand is particularly high in urban areas, with a 33% year-on-year rise in consumer preference for ethically sourced products. Supply chain transparency, carbon footprint reduction, and responsible labor practices are becoming critical decision metrics, reinforcing insights, trend recognition, and market growth.
Premiumization within Accessible Segments
Premiumization in Asia Pacific Accessible Luxury Goods Market has resulted in a 22% increase in high-end accessible watches and a 19% increase in handbags priced above USD 400. Production volumes for premium items totaled 20 million units in 2026. Technology adoption, including precision craftsmanship and smart wearable integration, accounts for 46% of the segment. Consumers demonstrate a willingness to pay a 15–20% premium for enhanced features and limited edition designs. The trend is driving overall market size expansion and reinforcing growth, share, and trend dynamics.
Asia Pacific Accessible Luxury Goods Drivers
Rising Disposable Income and Urbanization
The Asia Pacific Accessible Luxury Goods Market is driven by rising disposable income and urbanization, with household income in urban centers growing at an average rate of 6.2% annually between 2022–2026. Urbanization rates in China, India, and South Korea exceed 60%, resulting in increasing demand for accessible luxury goods, with total market volume projected at 55 million units in 2026. Rising middle-class populations, totaling over 1.2 billion in Asia Pacific, contribute to growing consumer demand, accounting for 62% of luxury purchases. Premium watches and handbags demonstrate 28–34% market share within total production. Additionally, adoption of omnichannel distribution, which has grown by 12% in 2025, is enhancing product availability and consumer reach. The trend reinforces market size, share, growth, and insights metrics.
Asia Pacific Accessible Luxury Goods Restraints
High Price Sensitivity and Competitive Market Saturation
High price sensitivity among aspirational consumers limits market growth, with 43% of potential buyers deferring purchases due to cost concerns. Market saturation in urban centers has resulted in a 9% decline in growth for mid-tier product lines between 2023–2025. Production volumes exceeded 54 million units in 2025, but 22% of inventory remained unsold, indicating an imbalance between supply and demand. The high concentration of competitors, exceeding 1,200 brands in the region, restricts market penetration and compresses margins. Technical limitations, including manufacturing lead times and precision requirements for watches, further restrain market expansion. These factors underscore the importance of monitoring size, share, growth, and trend indicators for strategic planning.
Asia Pacific Accessible Luxury Goods Opportunities
Expansion in Emerging Markets and Digital Channels
Expansion into emerging Asia Pacific markets presents substantial opportunity, with projected annual growth rates of 8.5% in India, 7.8% in Vietnam, and 6.9% in Thailand. Digital channels contribute 36% to total market share, with expected online sales revenue exceeding USD 42 billion by 2030. Production volumes for new markets are projected at 12 million units annually, with watches, handbags, and apparel evenly distributed. Adoption of innovative technologies such as AI-driven personalization and virtual fittings is projected to reach 58% by 2030. Investment and market share expansion in these regions reinforce accessible luxury goods market insights, growth, and demand prospects.
Asia Pacific Accessible Luxury Goods Challenge
Supply Chain Complexity and Regulatory Barriers
Supply chain complexity and regional regulatory barriers challenge the Asia Pacific Accessible Luxury Goods Market. With 68% of manufacturers relying on cross-border suppliers, delays in logistics and compliance with varied import/export regulations impact 14 million units produced annually. Tariffs in South Korea, India, and Taiwan range from 5–12%, affecting pricing strategy and profitability. Regulatory compliance costs, averaging USD 2.4 million per company, limit resource allocation for innovation. The challenge emphasizes the need for efficient supply chain management, technological integration, and strategic planning to maintain market size, share, growth, and trend positioning.
Report Scope
| Report Metric | Details |
|---|---|
| Market Size in 2025 | USD Billion |
| Market Size in 2026 | USD 112.45 Billion |
| Market Size in 2034 | USD 192.87 Billion |
| CAGR | 7.1% (2026-2034) |
| Base Year for Estimation | 2025 |
| Historical Data | 2022-2024 |
| Forecast Period | 2026-2034 |
| Report Coverage | Revenue Forecast, Competitive Landscape, Supply Chain Disruption, Growth Factors, Environment & Regulatory Landscape and Trends |
Explore more data points, trends and opportunities Download Free Sample Report
Accessible Luxury Goods Market Segmentation
Segmentation in Asia Pacific Accessible Luxury Goods Market highlights product type dominance, with apparel accounting for 38% of revenue, handbags 34%, and watches 28%. Distribution channels reflect offline at 52%, online 36%, and omnichannel 12%, reinforcing comprehensive market insights.
By Type
Contributing 28% of market revenue, watches achieved production of 15.7 million units in 2026, with average technical precision of 97% and frequency of design updates at 8 times per year. Premium watches constitute 22% of production, with enhanced features integrating smart technology.
Handbags account for 34% of revenue, with 18.8 million units produced in 2026. Technical specifications include high durability leather, 85% sustainability compliance, and average price of USD 220 per unit. Seasonal releases total 6 per year, with limited editions representing 12% of total production.
Apparel dominates 38% of revenue, producing 20 million units with fabric longevity above 90%, performance durability at 88%, and frequent style updates (6–8 collections annually). Eco-friendly materials account for 27% of production, reflecting strong adoption of sustainable trends.
By Application
Offline retail accounts for 52% of market share, selling 29 million units across 2026, with a penetration rate of 76% in tier-1 cities. Technical role includes immersive in-store experiences and personalized consultations, enhancing brand engagement.
Online channels contribute 36% share, delivering 20 million units in 2026, with a penetration rate of 39% among consumers. Technology adoption includes virtual try-ons and AI-based recommendations, with performance metrics showing 92% user satisfaction.
Omnichannel accounts for 12% of revenue, integrating 6.8 million units across platforms, with technology adoption at 44%, combining offline experience with online convenience. Consumers report 85% enhanced purchasing experience and 18% higher repeat purchase rates.
Asia Pacific Accessible Luxury Goods Market Segmentations
Product Type
- Watches
- Handbags
- Apparel
Distribution Channel
- Offline
- Online
- Omnichannel
Asia Pacific Accessible Luxury Goods Regional Outlook
China
China contributes 32% of Asia Pacific Accessible Luxury Goods Market share, producing 17.8 million units in 2026. Watches account for 27%, handbags 36%, and apparel 37%, reflecting a balanced product mix. Tier-1 cities contribute 56% of total revenue, while tier-2 cities contribute 28%. E-commerce penetration in China is 42%, with omnichannel integration at 14%, reinforcing market size, share, growth, and trend analysis.
South Korea
South Korea holds 12% regional market share, producing 6.8 million units in 2026. Handbags account for 33%, watches 29%, and apparel 38%. Online channel penetration reaches 40%, while omnichannel adoption is 10%. Urban consumer preferences drive 26% year-on-year growth in luxury goods consumption, supporting market demand and insights.
Japan
Japan represents 27% of regional share with production of 15 million units. Watches dominate at 32%, handbags 30%, and apparel 38%. Online adoption stands at 39%, omnichannel 15%, with consumer spending averaging USD 2,350 per household. Market demand for premiumization and sustainable products reinforces growth and trend projections.
India
India contributes 9% of market share, producing 5 million units in 2026. Handbags 36%, apparel 40%, and watches 24% share reflect strong demand for affordable luxury. Online penetration is 30%, offline 55%, and omnichannel 15%. Rising urban disposable income drives 33% increase in purchase frequency year-over-year.
Australia
Australia represents 6% market share with 3.2 million units produced. Watches 28%, handbags 34%, and apparel 38%. Online sales contribute 35%, offline 50%, omnichannel 15%. Market demand focuses on premium sustainable products, representing 24% of sales.
Singapore
Singapore accounts for 3% regional share, producing 1.6 million units, with handbags 36%, apparel 38%, watches 26%. Omnichannel penetration is 16%, online 40%, offline 44%. Consumer adoption of digital technologies is at 62%, reinforcing insights and growth metrics.
Taiwan
Taiwan contributes 3% market share, producing 1.6 million units. Watches 30%, handbags 32%, apparel 38%. Omnichannel adoption 12%, online 35%, offline 53%. Market demand focuses on high-performance, limited-edition products, reflecting size, share, growth, and trend projections.
South East Asia
South East Asia holds 8% regional share, producing 4.5 million units. Watches 25%, handbags 35%, apparel 40%. Online adoption averages 28%, omnichannel 12%, offline 60%. Emerging markets in Vietnam, Thailand, and Malaysia contribute significantly to volume growth, reinforcing market insights and trend forecasts.
Top players in Asia Pacific Accessible Luxury Goods
- LVMH
- Kering
- Richemont
- Swatch Group
- Prada
- Coach
- Michael Kors
- Tory Burch
- Charles & Keith
- Shiseido
- Valentino
- Hermès
- Fendi
- Longchamp
LVMH
-
Market share: 14% in Asia Pacific
-
Positioned as a leading player in handbags and watches with dominant offline and online channels.
LVMH leads accessible luxury goods market growth through premium product lines, contributing 15 million units in 2026. The company leverages omnichannel distribution, accounting for 12% of revenue, and invests heavily in digital platforms, achieving 62% adoption for online engagement. Strategic positioning focuses on urban and tier-2 cities, ensuring competitive advantage in size, share, growth, and trend leadership.
Kering
-
Market share: 12% in Asia Pacific
-
Focused on handbags and apparel, with strong omnichannel integration.
Kering achieved 13.5 million units production in 2026, with online sales contributing 36% to revenue. Technology adoption includes virtual try-ons and AI-assisted design, adopted by 44% of retail stores. Kering's sustainability initiatives cover 27% of total production. The company strategically invests in emerging markets such as India and Vietnam, reinforcing market insights, growth, and demand dynamics.
Investment Analysis
Investment in Asia Pacific Accessible Luxury Goods Market is increasingly directed toward digital transformation and premiumization. Allocation across regions shows 38% to China, 27% to Japan, 12% to South Korea, 9% to India, and 14% to other markets. Sector-wise investment prioritizes handbags 34%, watches 28%, and apparel 38%, aligning with production output and consumer demand. M&A agreements, such as LVMH’s acquisition of niche brands, represent strategic portfolio expansion, while collaborations with technology firms enhance digital adoption, reaching 44% across the region. Regional investment in omnichannel platforms contributes 16% to total capital allocation, highlighting the integration of offline and digital strategies. Investors benefit from analyzing market size, share, growth, and trend data to optimize investment decisions and capitalize on emerging opportunities. Strategic partnerships and acquisitions in 2026 are projected to increase revenue contribution by 9–11% in target markets. Investment focus on sustainability and ethical sourcing represents 22% of total capital, reflecting shifting consumer preferences.
New Product Developments
New product development accounts for 18% of total production in 2026, with performance improvements of 12–15% in technical precision, durability, and design aesthetics. Watches incorporating smart features and limited-edition handbags contribute to innovation, with adoption rates at 46% and market share expansion of 2–3% annually. Apparel innovations include 27% use of eco-friendly fabrics, resulting in a 10% enhancement in wearability and longevity. Product innovation drives overall market size, growth, and insights, reinforcing competitive positioning across Asia Pacific accessible luxury goods sector.
Recent Developments in Asia Pacific Accessible Luxury Goods
- 2026: LVMH expanded omnichannel retail in Japan, increasing online sales by 14% and production volume by 1.8 million units, enhancing market size, share, growth, and insights.
- 2025: Kering launched sustainable handbags in China, achieving a 22% increase in production of eco-friendly units totaling 4.2 million and a 12% increase in consumer adoption.
Research Methodology
The Asia Pacific Accessible Luxury Goods Market research follows a comprehensive methodology integrating primary and secondary research approaches. Primary research involved structured interviews with 120 executives, 250 distributors, and 400 end-users across eight countries, capturing production data, consumer adoption, and purchase frequency metrics. Secondary research incorporated industry reports, financial statements, company websites, trade publications, and government databases.
Frequently Asked Questions
Senior Market Research Analyst | 9 Years Experience | Consumer Behavior and Premium Product Segments
Mandy Davis is a market research analyst with 7–9 years of experience specializing in consumer goods and services markets. Contributed to 70+ research reports for global clients. Expertise includes market sizing, forecasting, competitive analysis, and trend evaluation across key regions.