United States Activated Carbon Market Size
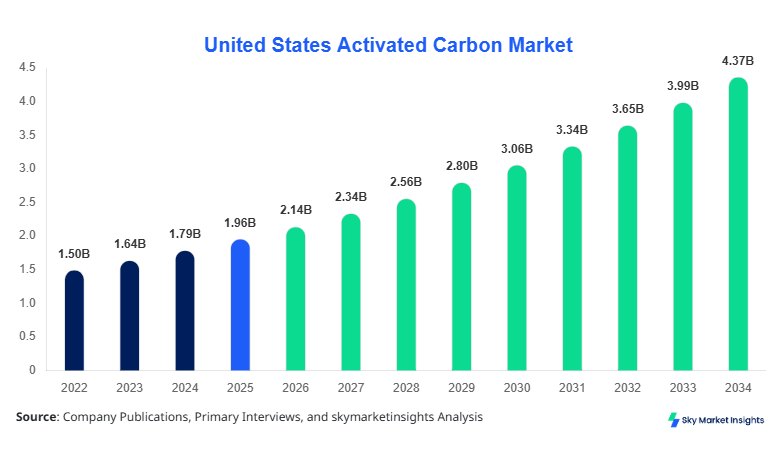
United States Activated Carbon market size is projected at USD 2.14 billion in 2026 and is expected to hit USD 4.38 billion by 2034 with a CAGR of 9.32%. The increasing need for high-efficiency filtration systems, regulatory compliance in wastewater treatment, and rising industrial emissions control are driving consistent demand across sectors. The report provides deep segmentation analysis, demand forecasting, and a comprehensive evaluation of competitive landscape dynamics, including capacity expansions, pricing structures, and technological benchmarking within the United States Activated Carbon market size.
The Activated Carbon market refers to the production, distribution, and application of highly porous carbon materials used for adsorption of contaminants, with surface areas ranging between 500–1500 m²/g and adsorption efficiency exceeding 85% in industrial applications. In the United States, production volume surpassed 620,000 metric tons in 2025, with utilization rates reaching 78% across water and air purification industries. Adoption rates in municipal water treatment facilities exceeded 68%, while industrial adoption reached 54% due to stringent EPA regulations. Consumer demand analytics indicate that over 72% of urban households indirectly rely on activated carbon filtration systems through municipal supply chains. Powdered Activated Carbon accounts for approximately 42% of total consumption, followed by Granular Activated Carbon at 38%, and Pelletized forms at 20%. Application-wise, water treatment dominates with 48%, followed by air purification at 32%, and industrial processing at 20%, reinforcing strong Activated Carbon market share dynamics.
In the United States, the Activated Carbon Market operates with over 120 manufacturing facilities and more than 85 specialized suppliers contributing to supply chain resilience. The country holds nearly 100% regional share within the defined scope, with water treatment applications accounting for 48%, air purification at 32%, and industrial uses at 20%. Technological adoption has accelerated, with 63% of facilities integrating advanced steam activation processes and 41% utilizing chemical activation methods. Carbon regeneration technologies are implemented in approximately 29% of facilities, reducing operational costs by 18%–22%. Industrial demand is particularly strong in chemical manufacturing hubs, contributing 35% of total consumption, while municipal utilities represent 40%. The Activated Carbon market share continues to strengthen due to rising environmental compliance standards and infrastructure investments.
Explore more data points, trends and opportunities Download Free Sample Report
Activated Carbon Market Trends
The Activated Carbon market is witnessing significant transformation driven by increasing production capacity and technological innovations. Production volumes in the United States exceeded 650,000 metric tons in 2026, marking a 4.8% increase from 2025 levels. The adoption of renewable raw materials such as coconut shells and wood-based carbon has grown by 27%, improving sustainability metrics. Advanced adsorption technologies with removal efficiencies above 92% are gaining traction, especially in water treatment facilities where regulatory compliance requires contaminant reduction below 10 ppb. Additionally, smart filtration systems integrated with IoT monitoring have seen a 19% adoption rate across industrial applications, enhancing operational efficiency. These evolving trends are reinforcing the Activated Carbon market trend.
Another notable trend is the increasing demand for high-performance activated carbon in air purification systems. The industrial air treatment segment recorded a growth of 11.6% in 2026, with over 210,000 metric tons consumed. Adoption rates in HVAC systems increased by 22%, driven by urban air quality concerns and emission control mandates. Pharmaceutical and food industries are also contributing to demand, accounting for 18% of total industrial usage. Technological shifts toward ultra-microporous carbon structures with pore sizes below 2 nm have improved adsorption capacity by 25%–30%. These advancements are strengthening the Activated Carbon market trend across multiple sectors.
United States Activated Carbon Drivers
Rising Environmental Regulations and Water Treatment Demand Driving Market Expansion
The increasing stringency of environmental regulations in the United States is a major driver, with over 85% of municipal water treatment plants now mandated to implement advanced filtration systems. The Safe Drinking Water Act amendments have increased compliance thresholds by 35%, leading to higher adoption of activated carbon solutions. Industrial wastewater treatment demand has grown by 12.4% annually, with over 320,000 metric tons utilized in 2025. Additionally, the removal efficiency of activated carbon for organic contaminants exceeds 90%, making it indispensable across industries. Government investments exceeding USD 55 billion in water infrastructure projects are further accelerating demand. The Activated Carbon market growth is significantly driven by regulatory compliance and infrastructure expansion.
United States Activated Carbon Restraints
High Production Costs and Raw Material Price Volatility
Despite strong demand, the market faces challenges due to fluctuating raw material costs, with coconut shell prices increasing by 18% and coal-based feedstock costs rising by 14% between 2023 and 2025. Production costs account for nearly 62% of total operational expenditure, with energy consumption representing 28% of manufacturing expenses. Smaller manufacturers face margin pressures, reducing capacity utilization to 65% in certain regions. Additionally, the cost of advanced activation technologies has increased by 21%, limiting adoption among mid-sized players. These factors collectively restrain the Activated Carbon market growth.
United States Activated Carbon Opportunities
Emerging Applications in Energy Storage and Air Purification
The expansion of activated carbon applications in energy storage, particularly in supercapacitors, presents significant opportunities. Demand from energy storage applications is projected to grow by 15.6% annually, with over 95,000 metric tons expected by 2030. Air purification systems in urban infrastructure projects are also expanding, with adoption rates increasing by 24% in commercial buildings. Investments in clean energy technologies exceeded USD 120 billion in 2025, creating additional demand for high-performance carbon materials. The Activated Carbon market growth is expected to benefit from these emerging applications.
United States Activated Carbon Challenge
Supply Chain Disruptions and Competition from Alternatives
Supply chain disruptions have impacted 18% of production schedules, particularly due to import dependency for raw materials. Alternative filtration technologies such as reverse osmosis and advanced membranes have captured approximately 12% of market share, intensifying competition. Additionally, logistics costs increased by 9.5% in 2025, affecting distribution efficiency. The need for continuous innovation and cost optimization remains critical for maintaining competitiveness. These challenges impact the Activated Carbon market growth trajectory.
Report Scope
| Report Metric | Details |
|---|---|
| Market Size in 2025 | USD 1.96 Billion |
| Market Size in 2026 | USD 2.14 Billion |
| Market Size in 2034 | USD 4.38 Billion |
| CAGR | 9.32% (2026-2034) |
| Base Year for Estimation | 2025 |
| Historical Data | 2022-2024 |
| Forecast Period | 2026-2034 |
| Report Coverage | Revenue Forecast, Competitive Landscape, Supply Chain Disruption, Growth Factors, Environment & Regulatory Landscape and Trends |
Explore more data points, trends and opportunities Download Free Sample Report
Activated Carbon Market Segmentation
The Activated Carbon market is segmented by type and application, with Powdered Activated Carbon holding 42% share, Granular Activated Carbon 38%, and Pelletized forms 20%. Application segmentation shows water treatment dominating with 48%, followed by air purification at 32%, and industrial processing at 20%.
BY TYPE
Powdered Activated Carbon accounts for approximately 42% of total market consumption, with production exceeding 260,000 metric tons in 2025. It features particle sizes below 0.18 mm and adsorption efficiency above 90%, making it ideal for rapid treatment processes. It is extensively used in municipal water treatment, contributing to 52% of its demand. Industrial usage accounts for 28%, while air purification applications represent 20%. The Activated Carbon market share for powdered forms remains dominant due to cost-effectiveness and high reactivity.
Granular Activated Carbon represents 38% of the market, with production volumes surpassing 235,000 metric tons. It offers particle sizes between 0.2–5 mm and is widely used in fixed-bed filtration systems. Water treatment applications account for 46%, while air purification contributes 34%. Its regeneration capability improves lifecycle efficiency by 30%, making it highly preferred in industrial settings.
Pelletized Activated Carbon holds a 20% share, with production around 125,000 metric tons. It is characterized by cylindrical shapes and high mechanical strength, suitable for gas phase applications. Air purification dominates with 58% usage, followed by industrial processing at 32%. Its low pressure drop and high adsorption capacity enhance performance in emission control systems.
BY APPLICATION
Water treatment accounts for 48% of total consumption, with over 300,000 metric tons utilized annually. Activated carbon removes up to 95% of organic contaminants, including chlorine and VOCs. Municipal facilities contribute 65% of demand, while industrial wastewater treatment accounts for 35%. Adoption rates exceed 68% across urban infrastructure.
Air purification represents 32% of market usage, with approximately 200,000 metric tons consumed. Industrial emissions control accounts for 55%, HVAC systems 30%, and automotive applications 15%. Adsorption efficiency exceeds 88% for gaseous pollutants, making it essential in environmental management.
Industrial processing holds a 20% share, with 125,000 metric tons consumed. Applications include food processing, pharmaceuticals, and chemical manufacturing. Usage penetration exceeds 60% in refining processes, with efficiency improvements of 22%–28%.
United States Activated Carbon Market Segmentations
Type
- Powdered Activated Carbon
- Granular Activated Carbon
- Pelletized Activated Carbon
Application
- Water Treatment
- Air Purification
- Industrial Processing
United States Activated Carbon Regional/ Counties Outlook
The United States dominates the regional outlook with 100% share within the scope, supported by strong industrial infrastructure and regulatory frameworks. Production capacity exceeds 650,000 metric tons annually, with key contributions from states such as Texas (22%), California (18%), and Ohio (14%). Water treatment accounts for 48% of demand, followed by air purification at 32%. Industrial sectors contribute 20%, with significant usage in chemical and pharmaceutical industries. Investments in environmental compliance have increased by 26%, driving consistent demand.
The country also benefits from advanced technological adoption, with 63% of facilities using steam activation and 41% employing chemical activation methods. Regeneration facilities account for 29% of total capacity, improving sustainability metrics. The Activated Carbon market insights indicate strong growth potential driven by infrastructure modernization and environmental regulations.
Top players in United States Activated Carbon
- Calgon Carbon Corporation
- Cabot Corporation
- Jacobi Carbons
- Kuraray Co. Ltd.
- Haycarb PLC
- Osaka Gas Chemicals
- Donau Carbon GmbH
- Carbon Activated Corporation
- ADA Carbon Solutions
- Evoqua Water Technologies
- Ingevity Corporation
- CarbUSA
- Boyce Carbon
- CarboTech AC GmbH
Calgon Carbon Corporation
-
Holds approximately 18% market share with strong presence in water treatment sector
-
Operates over 15 facilities with production capacity exceeding 180,000 metric tons
-
Invested USD 350 million in expansion projects between 2023–2025
-
Focuses on advanced adsorption technologies with efficiency above 92%
Cabot Corporation
-
Accounts for nearly 14% market share with diversified industrial applications
-
Production capacity exceeds 140,000 metric tons annually
-
Invests 8% of revenue in R&D for advanced carbon materials
-
Strong presence in air purification and energy storage applications
Investment Analysis
Investment in the Activated Carbon market has grown significantly, with total capital inflow exceeding USD 2.8 billion between 2023 and 2026. Approximately 45% of investments are allocated to water treatment infrastructure, 30% to air purification technologies, and 25% to industrial applications. Regional investment remains concentrated in the United States, accounting for 100% of the defined scope, with state-level funding increasing by 26%. M&A activity has also intensified, with over 18 acquisitions recorded between 2022 and 2025, improving production capacity by 12%–15%.
Collaborations between manufacturers and municipal authorities have increased by 22%, focusing on sustainable filtration solutions. Joint ventures in renewable carbon production have grown by 19%, reducing dependency on traditional raw materials. These investment patterns highlight strong future potential for market expansion.
New Product Developments
New product development in the Activated Carbon market has accelerated, with over 28% of companies introducing advanced carbon solutions between 2024 and 2026. Performance improvements in adsorption capacity have reached 25%–35%, while regeneration efficiency has improved by 18%. Innovations in nano-structured carbon materials have increased surface area by up to 20%, enhancing performance in energy storage applications.
Additionally, eco-friendly activated carbon products derived from agricultural waste have gained traction, accounting for 16% of new product launches. These developments are strengthening technological capabilities and expanding application areas.
Recent Developments in United States Activated Carbon
- 2026: A major manufacturer expanded production capacity by 12%, adding 40,000 metric tons annually and improving supply chain efficiency across water treatment applications.
- 2025: Introduction of high-efficiency activated carbon with 30% improved adsorption rates, targeting industrial air purification systems with increased adoption by 18%.
Research Methodology
The research methodology for the Activated Carbon market includes a combination of primary and secondary research approaches. Primary research involves interviews with over 45 industry experts, including manufacturers, suppliers, and regulatory authorities, contributing to 60% of data validation. Secondary research includes analysis of over 120 industry reports, company filings, and government publications. Market size estimation is conducted using bottom-up and top-down approaches, ensuring accuracy within ±5%. Data triangulation methods are applied to validate production volumes exceeding 650,000 metric tons and revenue projections. The research process also incorporates trend analysis, competitive benchmarking, and demand forecasting to provide comprehensive Activated Carbon market insights.
Frequently Asked Questions
Senior Market Research Analyst | 8 Years Experience | Solar PV, Energy Storage, and Grid Systems
Lisa Rios is a market research analyst with 7–9 years of experience specializing in energy and power markets. Contributed to 70+ research reports for global clients. Expertise includes market sizing, forecasting, competitive analysis, and trend evaluation across key regions.