Middle East and Africa Automated Truck Loading System Market Size
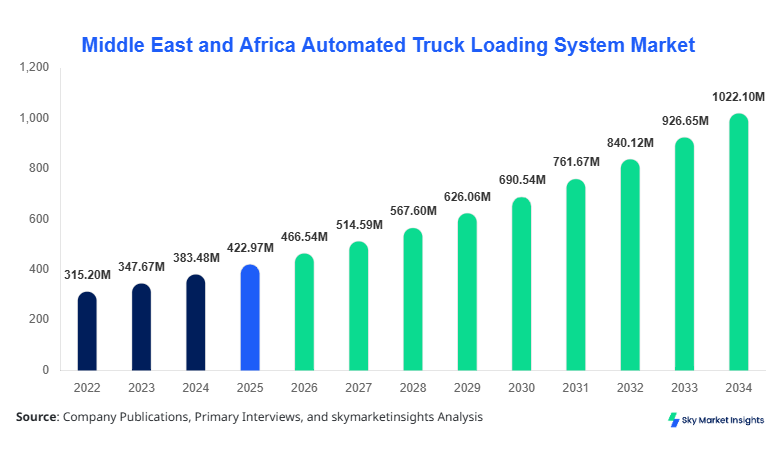
Middle East and Africa Automated Truck Loading System Market size is projected at USD 466.54 million in 2026 and is expected to hit USD 979.10 million by 2034 with a CAGR of 10.3%. The study evaluates 6 countries, 8 system types, 5 truck categories, 4 dock designs, 8 industries, 2 automation levels, and 3 component classes, alongside technology adoption and the competitive landscape.
Key Takeaways
- The United Arab Emirates dominates the country landscape with 40.45% of 2026 revenue and is forecast to reach USD 394.33 million by 2034 at a 9.65% CAGR.
- South Africa is the fastest-growing listed country at a 10.19% CAGR, increasing from USD 46.81 million in 2026 to USD 101.73 million by 2034.
- Chain conveyor systems lead system-type revenue with a 25.11% share in 2026 and USD 254.08 million projected for 2034.
- Skate conveyor systems are the fastest-growing system type at a 10.26% CAGR, reaching USD 92.80 million by 2034.
- Saudi Arabia represents the second-largest country opportunity, advancing from USD 123.21 million in 2026 to USD 256.15 million in 2034 at a 9.58% CAGR.
The Automated Truck Loading System Market covers integrated conveyors, skates, AGVs, robotics, sensors, controls, and software used to transfer cargo between warehouses and trucks with limited manual intervention. Regional revenue rises from USD 425.25 million in 2025 to USD 466.54 million in 2026. The United Arab Emirates contributes 40.45% of 2026 country revenue, Saudi Arabia 26.41%, and South Africa 10.03%. By technology, chain conveyors account for 25.11% of the 2026 system-type total, roller tracks 19.78%, and slat conveyors 16.51%.
Explore more data points, trends and opportunities Download Free Sample Report
Middle East and Africa Automated Truck Loading System Market Trends
Connected loading docks and interoperable automation
Warehouse operators are shifting toward sensor-controlled docks, digital twins, machine vision, and interfaces connecting warehouse-management, transport-management, and automated-storage platforms. A representative 100-dock network processing 26 pallets per trailer can handle 2,600 pallets per loading cycle; reducing a 35–45-minute manual cycle to approximately 2–8 minutes can materially expand daily throughput.
The technology mix is also moving from fixed mechanical equipment toward modular AGV and robotic configurations. In a benchmark facility operating 16 hours daily, raising automated dock penetration from 20% to 40% can double the number of automation-enabled doors, while predictive-maintenance programs targeting 95% availability and less than 5% unplanned downtime support FMCG, retail, parcel, pharmaceutical, and cold-chain operations.
Middle East and Africa Automated Truck Loading System Market Drivers
Higher warehouse throughput and safer material movement
Distribution centres are seeking faster dispatch with fewer forklift movements and lower exposure to dock accidents. A site completing 40 truck turns daily at 40 minutes each consumes about 1,600 loading minutes; cutting the cycle to 8 minutes reduces this to 320 minutes, a theoretical 80% saving. Systems designed for 26-pallet trailers can also support more than 1,000 pallet movements across 40 daily loads.
Middle East and Africa Automated Truck Loading System Market Restraints
Capital intensity and infrastructure incompatibility
Retrofitting doors, floors, conveyors, controls, and trailers can require 5–7 integrated workstreams and 3–12 months of engineering and commissioning. For operators with fewer than 10 daily truck movements, utilization may remain below 30%, while mixed pallets, floor tolerances exceeding 10–20 millimetres, and fleet standardization below 50% can extend payback periods and constrain deployment.
Middle East and Africa Automated Truck Loading System Market Opportunities
Modular systems for unmodified trailers
Compact loaders, mobile AGVs, and vision-guided robots can address facilities where only 1–3 docks initially qualify for automation. A phased installation that starts with 20% of doors and later reaches 60% reduces first-stage disruption, while equipment capable of servicing 40-foot and 53-foot units expands applicability across consumer goods, chemicals, construction materials, and export logistics.
Challenges in Middle East and Africa Automated Truck Loading System Market
Cargo variability and systems integration
Loads can differ across 5 truck types, 4 dock layouts, and palletized, bagged, parcel, drum, or oversized formats. Achieving 99% identification accuracy while holding cycle exceptions below 2% requires coordinated sensors, safety controls, warehouse software, and trailer-positioning systems. Temperature-controlled operations may additionally need uptime above 95% and door-open reductions of 20–40%.
Report Scope
| Report Metric | Details |
|---|---|
| Market Size in 2025 | USD 422.99 Million |
| Market Size in 2026 | USD 466.54 Million |
| Market Size in 2034 | USD 979.1 Million |
| CAGR | 10.3% (2026-2034) |
| Base Year for Estimation | 2025 |
| Historical Data | 2022-2024 |
| Forecast Period | 2026-2034 |
| Report Coverage | Revenue Forecast, Competitive Landscape, Supply Chain Disruption, Growth Factors, Environment & Regulatory Landscape and Trends |
Explore more data points, trends and opportunities Download Free Sample Report
Middle East and Africa Automated Truck Loading System Market Segmentation
The Automated Truck Loading System Market is segmented by system type, truck type, dock design, industry, automation level, and component. Chain conveyors hold 25.11% of 2026 system revenue, while roller tracks and slat conveyors contribute 19.78% and 16.51%, respectively.
By System Type
Chain conveyor systems are the largest category, increasing from USD 117.24 million in 2026 to USD 254.08 million in 2034 at a 10.15% CAGR. Their 2026 contribution is 25.11%, supported by standardized pallet and shuttle movements.
Skate conveyor systems are the fastest-growing category at a 10.26% CAGR, advancing from USD 42.48 million to USD 92.80 million. AGV-based systems follow at 10.23%, while roller tracks reach USD 190.54 million in 2034.
By Truck Type
Standard trailer trucks are assessed as the principal deployment class because they support repeatable pallet transfer across 40-foot and 53-foot formats. No separate subsegment revenue or CAGR was supplied; the addressable regional reference remains USD 466.54 million in 2026 and USD 979.10 million in 2034.
Refrigerated, containerized, flatbed, and special-purpose trucks form the remaining categories. Their individual growth rates are not quantified in the supplied dataset; collectively, they operate within the stated 2026–2034 regional forecast and its 10.3% CAGR.
By Loading Dock Design
Flush docks represent the principal configuration for direct conveyor alignment and controlled trailer positioning. Separate dock-design values were not provided; accordingly, no portion of the USD 466.54 million 2026 total or USD 979.10 million 2034 total is independently assigned.
Enclosed, open, and sawtooth docks require different guarding, weather protection, and vehicle-alignment arrangements. Their individual CAGRs are unavailable, while the overall reference period spans 8 years and carries a 10.3% regional CAGR.
By Industry
FMCG and retail constitute the leading adoption environment due to repeatable pallets, high dispatch frequency, and 16–24-hour distribution schedules. Industry-specific revenue is not supplied; the applicable regional benchmarks remain USD 425.25 million in 2025 and USD 466.54 million in 2026.
E-commerce and logistics are positioned as the fastest-adopting operational category, driven by parcel volumes and shorter dispatch windows, but no defensible subsegment CAGR is available. Pharmaceuticals, food and beverage, chemicals, postal services, and other industries complete the 8-industry framework.
By Automation Level
Semi-automated systems remain important for phased installations involving 1–3 docks and mixed trailer fleets. No revenue split is supplied between the 2 automation levels, preventing allocation of the USD 466.54 million recorded for 2026.
Fully automated systems offer the stronger long-term adoption profile through unmanned transfer and integrated controls, although a separate CAGR is unavailable. Both categories are included within the regional 10.3% CAGR and USD 979.10 million 2034 projection.
By Component
Hardware is the principal component class because installations require conveyors, AGVs, robots, sensors, barriers, and control panels. Component-specific values were not supplied; therefore, the USD 466.54 million 2026 total is not apportioned among hardware, software, and services.
Software is expected to record the quickest technology adoption, followed by installation, integration, and maintenance services, but no component CAGR is stated. The 3 categories collectively support the 2026–2034 forecast horizon and its USD 512.56 million absolute expansion.
Middle East and Africa Automated Truck Loading System Market Segmentations
By System Type
- Chain Conveyor System
- Slat Conveyor System
- Roller Track System
- Belt Conveyor System
- Skate Conveyor System
- Automated Guided Vehicles (AGVs) Based System
- Robotic Arm-Based System
- Others (e.g., telescopic belt loaders, modular lift systems)
By Truck Type
- Standard Trailer Trucks
- Refrigerated/Cold Chain Trucks
- Containerized Trucks
- Flatbed Trucks
- Special Purpose Trucks
By Loading Dock Design
- Flush Docks
- Enclosed Docks
- Open Docks
- Sawtooth Docks
By Industry
- Automotive
- FMCG and Retail
- E-commerce and Logistics
- Pharmaceuticals and Healthcare
- Food and Beverage
- Chemicals
- Postal and Courier
- Others (Textile, Electronics, Aerospace, etc.)
By Automation Level
- Semi-Automated Systems
- Fully Automated Systems
By Component
- Hardware
- Software
- Services (Installation, Maintenance, Integration)
Middle East and Africa Automated Truck Loading System Market Country Outlook
Brazil Middle East and Africa Automated Truck Loading System Market
Brazil lies outside the defined Middle East and Africa scope and consequently contributes 0% to the supplied USD 466.54 million 2026 total and USD 979.10 million 2034 forecast. No Brazilian production or sector split is allocated.
Mexico Middle East and Africa Automated Truck Loading System Market
Mexico is outside the report geography and contributes 0% to both the 2025 value of USD 425.25 million and 2026 value of USD 466.54 million. Country production and industry contributions are therefore not included.
Argentina Middle East and Africa Automated Truck Loading System Market
Argentina has a 0% contribution to this regional dataset because it is not a Middle Eastern or African country. The supplied scope contains 6 countries and an overall 10.3% CAGR rather than an Argentine forecast.
Chile Middle East and Africa Automated Truck Loading System Market
Chile is excluded geographically and accounts for 0% of the regional totals in 2026 and 2034. No Chile-specific production, logistics, retail, or food-sector allocation is available from the mandatory dataset.
Colombia Middle East and Africa Automated Truck Loading System Market
Colombia similarly contributes 0% to the defined regional figures. Within the actual scope, the United Arab Emirates contributes 40.45% in 2026, Saudi Arabia 26.41%, and South Africa 10.03%.
Top players in Middle East and Africa Automated Truck Loading System Market
- Joloda Hydraroll Group
- Ancra Systems
- Actiw
- BEUMER Group
- TRAPO AG
- HAVER & BOECKER
- FLSmidth
- Cargo Floor
- Euroimpianti
- Secon Components
- Duro Felguera
- Norpak Handling
- Damon Technology
- Anqiu Boyang Machinery
Top Two Companies
-
Joloda Hydraroll Group: An indicative competitive assessment places the company in a 10–15% leadership band rather than an audited regional revenue share. Its positioning is supported by mechanical skate, moving-floor, slipchain, LoadPlate, and LoadMatic technologies covering automated and semi-automated workflows. Systems can reduce conventional 30–45-minute loading processes to below 5 minutes, while compatibility with AGVs supports up to 100% end-of-line automation.
-
Ancra Systems: An indicative 8–12% competitive band reflects its established position in automated trailer loading, including Skateloader and LoadRunner solutions. The company focuses on standardized pallet and unit-load applications where turnaround can decline from roughly 30 minutes to 3–8 minutes. Its combination of equipment, controls, trailer interfaces, and aftermarket support strengthens positioning across high-frequency manufacturing and distribution routes.
Recent Developments in Middle East and Africa Automated Truck Loading System Market
- 2025: Actiw introduced LoadMatic Lite as a compact entry system requiring limited facility and fleet modification.
- 2025: LoadMatic Lite was presented at LogiMAT alongside automated, semi-automated, and manual loading technologies.
Research Methodology
The study applies a 3-stage process combining secondary research, company and technology mapping, and bottom-up reconciliation. The mandatory dataset was used for 2025, 2026, and 2034 values, 6 country forecasts, 8 system-type forecasts, and stated CAGRs. Shares were calculated as subsegment revenue divided by the relevant 2026 total, while operational figures were treated as industry benchmarks rather than market-value inputs.
Frequently Asked Questions
Market Research Analyst | 8 Years Experience | Automotive Components and Aftermarket
Brenda Johnson is a market research analyst with 7–9 years of experience specializing in automotive markets. Contributed to 70+ research reports for global clients. Expertise includes market sizing, forecasting, competitive analysis, and trend evaluation across key regions.