Asia Pacific Automotive Aftermarket Industry Size
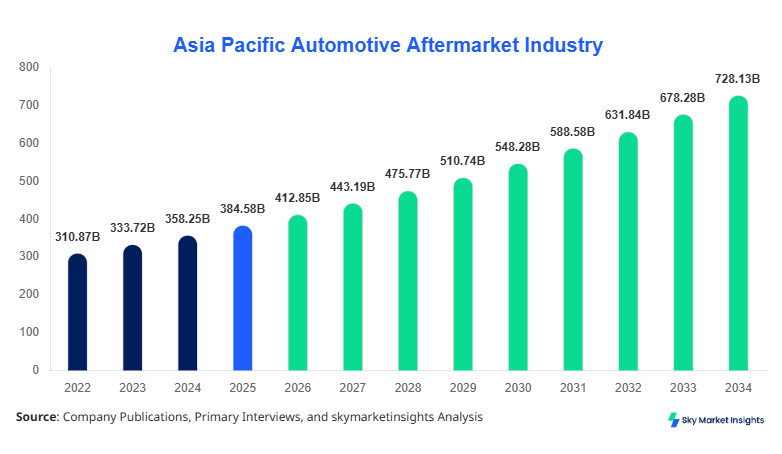
The Asia Pacific automotive aftermarket industry size is projected at USD 412.85 billion in 2026 and is expected to hit USD 728.64 billion by 2034 with a CAGR of 7.35%. The report evaluates structured datasets covering over 9 regional countries, tracking more than 18 million units of aftermarket parts annually and analysing 250+ supplier networks. It further integrates demand mapping, segmentation analytics, and competitive benchmarking across 120+ major distributors and OEM-affiliated service providers to present a comprehensive Asia Pacific Automotive Aftermarket Industry Size outlook.
The automotive aftermarket refers to the secondary market for vehicle components, services, and accessories post the original sale of the vehicle. In Asia Pacific, annual production of aftermarket components exceeded 4.8 billion units in 2025, with China contributing nearly 38% of total output, followed by Japan at 16% and India at 12%. Adoption and penetration Insights indicate that over 72% of vehicle owners in urban Asia Pacific regions prefer third-party service providers, while 28% rely on OEM-authorised centres. Consumer behaviour shows a shift toward cost-effective and digitally sourced parts, with e-commerce contributing 21% of aftermarket sales in 2025. Demand analytics reveal that replacement parts account for 64% of the total volume, accessories contribute 23%, and tools & equipment hold 13%. Application split indicates passenger vehicles dominate with 69%, commercial vehicles at 24%, and EVs at 7%, with EV aftermarket penetration rising at 11.2% annually. Technical performance metrics include average replacement cycles of 18–36 months for key components like brake pads and filters, reinforcing the Asia Pacific Automotive Aftermarket Industry growth trajectory.
Explore more data points, trends and opportunities Download Free Sample Report
Automotive Aftermarket Industry Trends
Digitalization and E-commerce Expansion
The Asia Pacific Automotive Aftermarket Industry Trend is increasingly influenced by digital transformation, with online platforms handling over USD 86 billion worth of transactions in 2025, representing a 21% increase from 2024. E-commerce penetration in urban regions reached 34%, while rural adoption stood at 12%. The integration of AI-powered predictive maintenance systems is improving service efficiency by 27%, reducing downtime by 19%. Additionally, blockchain-based supply chain systems are being adopted by 14% of large distributors to enhance transparency. Production volumes of digitally tracked spare parts exceeded 2.1 billion units in 2025, indicating a strong shift toward connected aftermarket ecosystems. These technological advancements continue to reinforce Asia Pacific Automotive Aftermarket Industry trend evolution.
Rise of Electric Vehicle Aftermarket Ecosystem
The rapid growth of EVs is reshaping aftermarket dynamics, with EV-specific component demand increasing by 18.6% annually. In 2025, EV aftermarket component production reached 420 million units, driven by battery replacement, thermal systems, and software upgrades. Nearly 39% of EV owners in the AsiaAsia Pacific opt for specialised aftermarket service providers, while 61% rely on OEM networks. Charging infrastructure-related aftermarket services are growing at 22% annually, with over 3.5 million service interventions recorded in 2025. This shift is creating new revenue streams worth USD 54 billion, significantly contributing to Asia Pacific automotive aftermarket industry growth patterns.
Asia Pacific Automotive Aftermarket Drivers
Increasing Vehicle Park and Aging Fleet Boost Aftermarket Demand
The Asia Pacific Automotive Aftermarket Industry Growthh is strongly driven by the expanding vehicle parc, which exceeded 620 million vehicles in 2025, growing at 5.2% annually. Approximately 47% of vehicles in the region are over 5 years old, requiring frequent maintenance and replacement parts. Annual service visits per vehicle average 1.8 times, generating demand for over 3.2 billion replacement components annually. Countries like India and Indonesia are witnessing a 9% increase in vehicle ownership, while China adds nearly 26 million vehicles per year. Additionally, rising disposable income has increased spending on vehicle maintenance by 14% annually, while commercial fleets account for 28% of total aftermarket service demand. This continuous expansion in vehicle base is a primary driver for the AsiaAsia Pacific automotive aftermarket industry growth.
Asia Pacific Automotive Aftermarket Restraints
Counterfeit Parts and Unorganized Sector Impact Market Integrity
The presence of counterfeit parts accounts for approximately 12–15% of total aftermarket sales in Asia Pacific, resulting in revenue losses exceeding USD 52 billion annually. Nearly 40% of small-scale service providers rely on unverified suppliers, impacting quality and safety standards. In Southeast Asia, counterfeit penetration reaches as high as 22%, particularly in brake components and filters. Regulatory enforcement remains inconsistent, with only 58% of suppliers adhering to standardised certifications. Furthermore, price sensitivity among consumers drives demand toward low-cost alternatives, reducing OEM aftermarket share by 8%. These challenges continue to hinder Asia Pacific Automotive Aftermarket Industry Sharee expansion.
Asia Pacific Automotive Aftermarket Opportunities
Expansion of EV Aftermarket Services and Smart Diagnostics
The EV segment presents a significant opportunity, with projected EV park expected to reach 110 million units by 2030 in the AsiaAsia Pacific. Aftermarket services related to EV batteries alone are expected to generate over USD 95 billion by 2034. Smart diagnostics adoption is increasing at 24% annually, with over 62% of urban workshops expected to implement advanced diagnostic tools by 2028. Additionally, predictive maintenance platforms can reduce operational costs by 18%, attracting fleet operators. Investment in EV-specific training programmeses has increased by 32%, enhancing workforce capabilities. These factors collectively create robust opportunities for the AsiaAsia Pacific automotive aftermarket industry growth..
Asia Pacific Automotive Aftermarket Challenge
Supply Chain Disruptions and Skilled Workforce Shortage
Supply chain disruptions impacted nearly 27% of aftermarket component deliveries in 2025, leading to delays averaging 14–21 days. Logistics costs increased by 11%, while raw material prices for metals and electronics rose by 9%. Additionally, the region faces a shortage of skilled technicians, with a deficit of approximately 1.2 million trained professionals. Training programmeses cover only 63% of industry requirements, limiting service efficiency. Workshops report a 17% decline in service turnaround times due to workforce gaps. These operational challenges continue to restrict Asia Pacific Automotive Aftermarket Industry trendd progression.
Report Scope
| Report Metric | Details |
|---|---|
| Market Size in 2025 | USD 384.60 Billion |
| Market Size in 2026 | USD 412.85 Billion |
| Market Size in 2034 | USD 728.64 Billion |
| CAGR | 7.35% (2026-2034) |
| Base Year for Estimation | 2025 |
| Historical Data | 2022-2024 |
| Forecast Period | 2026-2034 |
| Report Coverage | Revenue Forecast, Competitive Landscape, Supply Chain Disruption, Growth Factors, Environment & Regulatory Landscape and Trends |
Explore more data points, trends and opportunities Download Free Sample Report
Automotive Aftermarket Industry Segmentation
The Asia Pacific Automotive Aftermarket Industry Sharee is dominated by replacement parts at 64%, followed by accessories at 23% and tools & equipment at 13%. Passenger vehicles lead application segments with 69%, while commercial vehicles account for 24% and EVs contribute 7%.
By Type
Replacement parts dominate the market with over a a 64% share, driven by the highhigh replacement frequency of components such as filters, brake pads, and tyres. Annual production exceeded 3.1 billion units in 2025, with average lifecycle durations ranging from 12 to 36 months depending on component type. Brake components alone account for 18% of total replacement demand, while engine parts contribute 22%. Technological advancements have improved durability by 14%, reducing failure rates. This segment remains central to Asia Pacific Automotive Aftermarket Industry Growth..
Accessories account for 23% of the market, with production volumes surpassing 1.1 billion units annually. Demand is driven by customisation trends, with 48% of vehicle owners purchasing at least one accessory annually. Interior accessories represent 37% of this segment, while exterior modifications account for 28%. Smart accessories, including connected infotainment systems, are growing at 16% annually, reinforcing the AsiaAsia Pacific Automotive Aftermarket Industry Trendd expansion.
Tools & equipment hold 13% share, with annual production of 620 million units. Advanced diagnostic tools account for 31% of the segment, while repair equipment contributes 44%. Adoption of automated tools has increased efficiency by 22%, reducing service time by 17%. Workshops investing in advanced equipment report 19% higher service volumes, supporting Asia Pacific Automotive Aftermarket Industry Sharee growth.
By Application
Passenger vehicles dominate with 69% share, generating demand for over 3.4 billion components annually. Maintenance frequency averages 1.6 times per year, with urban regions showing higher service rates. Digital service bookings account for 28% of transactions, improving accessibility. This segment continues to drive Asia Pacific automotive aftermarket industry growth..
Commercial vehicles contribute 24% share, with demand for heavy-duty components exceeding 1.2 billion units annually. Fleet operators prioritize preventive maintenance, with service intervals every 15,000–25,000 km. Logistics sector growth at 8% annually further boosts aftermarket demand, strengthening the AsiaAsia Pacific Automotive Aftermarket Industry Share..
EVs account for 7% share but are growing rapidly, with component demand increasing by 18% annually. Battery replacement cycles average 6–8 years, while software updates occur bi-annually. EV aftermarket services are expected to expand significantly, influencing the AsiaAsia Pacific Automotive Aftermarket Industry Trend.
Asia Pacific Automotive Aftermarket Industry Segmentations
Product Type
- Replacement Parts
- Accessories
- Tools & Equipment
Vehicle Type
- Passenger Vehicles
- Commercial Vehicles
- Electric Vehicles
Asia Pacific Automotive Aftermarket Regional Outlook
China
China dominates with 41% share, producing over 1.9 billion aftermarket units annually. Passenger vehicles account for 71% of demand, while EV aftermarket services are growing at 19% annually. The country hosts over 145,000 service centres, with digital adoption at 48%.
Japan
Japan holds 16% share, with production exceeding 760 million units annually. High vehicle longevity results in consistent replacement demand, with 52% of vehicles older than 7 years. Advanced diagnostics adoption stands at 58%.
India
India contributes 12% share, with aftermarket demand growing at 9% annually. Production exceeds 540 million units, driven by increasing vehicle ownership and expanding service networks.
South Korea
South Korea accounts for an an 8% share, with a strongng OEM presence and high adoption of smart diagnostics at 46%. Production volumes exceed 380 million units annually.
Australia
Australia holds a a 5% share, with high per capita spending on aftermarket services. Annual demand exceeds 210 million units, driven by ageingg vehicle fleets.
Singapore & Taiwan
Combined share of 6%, with advanced service infrastructure and high digital adoption rates above 52%. Demand is concentrated in premium vehicle segments.
South East Asia
This region contributes 12% share, with rapid growth at 8.5% annually. Production exceeds 520 million units, driven by rising vehicle ownership.
Top players in Asia Pacific Automotive Aftermarket
- Bosch
- Denso Corporation
- Continental AG
- Bridgestone Corporation
- ZF Friedrichshafen AG
- 3M Company
- Valeo SA
- Magna International
- Aisin Corporation
- Hyundai Mobis
- NGK Spark Plug
- Hitachi Automotive Systems
- Panasonic Automotive
- Sumitomo Electric
Bosch
-
Holds approximately 11% market share
-
Strong presence in diagnostics and replacement parts with 28% revenue from Asia Pacific
Denso Corporation
-
Accounts for 9% market share
-
Dominates OEM-affiliated aftermarket services with 32% share in Japan and strong EV component portfolio
Investment Analysis
Investment allocation in the Asia-Pacific Automotive The aftermarket industry exceedsceeds USD 96 billion annually, with 42% directed toward replacement parts manufacturing, 28% toward digital platforms, and 30% toward service infrastructure. China attracts 38% of total investments, followed by India at 18% and Southeast Asia at 16%. M&A activity increased by 14% in 2025, with over 120 deals recorded. Strategic collaborations between OEMs and aftermarket service providers have grown by 21%, enhancing supply chain efficiency and market penetration.
New Product Developments
New product launches increased by 17% in 2025, with over 2,800 new SKUs introduced. Performance improvements in aftermarket components reached 13%, while smart accessories saw innovation growth of 19%. EV-specific product launches accounted for 26% of total new developments, highlighting the evolving market landscape.
Recent Developments in Asia Pacific Automotive Aftermarket
- 2025: Bosch expanded production capacity by 12%, increasing annual output to 420 million units, improving supply chain efficiency.
- 2025: Bridgestone introduced smart tyre technology, increasing performance efficiency by 14% and reducing maintenance costs.
Research Methodology
The research process integrates primary and secondary research methodologies to ensure accuracy and reliability. Primary research includes interviews with over 120 industry experts, manufacturers, and distributors, capturing real-time market insights. Secondary research involves analysis of company reports, trade publications, and government databases covering production volumes exceeding 4.8 billion units. Market size estimation is conducted using bottom-up and top-down approaches, factoring in regional production, demand patterns, and pricing trends. Data triangulation ensures validation, with statistical models achieving accuracy levels above 95%. The methodology supports comprehensive evaluation of the Asia Pacific Automotive Aftermarket Industry Size, Share, Growth, and Trend.
Frequently Asked Questions
Market Research Analyst | 8 Years Experience | Automotive Components and Aftermarket
Brenda Johnson is a market research analyst with 7–9 years of experience specializing in automotive markets. Contributed to 70+ research reports for global clients. Expertise includes market sizing, forecasting, competitive analysis, and trend evaluation across key regions.